If you are on the blog page in a web browser from a computer, please subscribe to this using the "Follow by Email" link to the left. Having your email helps me to notify you when Google mucks up email distribution, as they did at the beginning of May.
~~~~~~~
There are no open positions going into the open for Tuesday, February 21st.
There are no pending purchase orders going into the open for Tuesday, February 21st.
~~~~~~~
Weekly Summary
For the week ending 2/17, here are the transactions:

Click on the image to enlarge
For the week ending 2/17 the position in XLE was closed for a net profit of $143.70 on all accounts. This represents a 0.21% weekly change, which is slightly lower than the midpoint in the Monte Carlo analysis:

Click on the image to enlarge
For a year's worth of data, taking any arbitrary set of 10 weeks, the weekly change in average return is just over 0.31%.
~~~~~~~
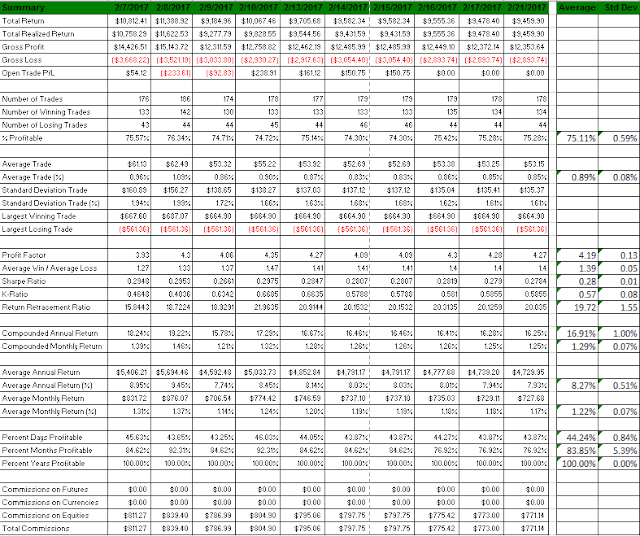

Consistency of Trades
Here I introduce a new chart so that we can look at overall deviations in performance was we move forward.
The following chart shows the day-over-day performance of the strategies, using the 1-Year Rolling Performance lookback period. What we are looking to see here is that the far right column (Std Dev) is very stable as we move through time. So far, with two weeks of data, the overall system is performing very well and is quite stable. This will be updated weekly.

Click on the image to enlarge
As we go forward, pay particular attention to the following lines:
- % Profitable (averaging 75.11% +/- 0.59%)
- Average Trade (Profit) (averaging 0.89% +/- 0.08%)
- Profit Factor (averaging 4.19 +/- 0.13)
- Return Retracement Ratio (averaging 19.72 +/- 1.55)
- Compounded Annual Return (averaging 16.91% +/- 1.00%)
- Average Annual Return (averaging 8.27%, +/- 0.51%)
Of course, our actual performance will vary from this, but at least we are in the right ballpark.
I re-iterate: these are great numbers for the amount of risk that is being taken.
~~~~~~~
Capital Deployment
I am still well-under in terms of capital deployment, so there is potentially significant room for improvement. Here is the 1-year lookback on capital deployment; we want 100%, and the fact that we only hit this a few times over the past year shows there is a tremendous amount of idle cash:

Click on the image to enlarge
All the areas that are NOT at 100% means that capital is sitting on the sideline. I am only deploying 4 strategies right now, out of a minimum of 14, so much work lies ahead.
~~~~~~~
1-Year Rolling Performance
Historical, rolling, 1-year performance is as follows. The numbers will be different than previous blog entries because this is a ROLLING snapshot -- the period shown below is 2/19/2016 to 2/18/2017 (Saturday morning, to capture all end-of-day trades on the previous day):
| Summary | Value |
| Total Return | $9,459.90 |
| Total Realized Return | $9,459.90 |
| Gross Profit | $12,353.64 |
| Gross Loss | ($2,893.74) |
| Open Trade P/L | $0.00 |
| Number of Trades | 178 |
| Number of Winning Trades | 134 |
| Number of Losing Trades | 44 |
| % Profitable | 75.28% |
| Average Trade | $53.15 |
| Average Trade (%) | 0.85% |
| Standard Deviation Trade | $135.37 |
| Standard Deviation Trade (%) | 1.61% |
| Largest Winning Trade | $664.90 |
| Largest Losing Trade | ($561.36) |
| Profit Factor | 4.27 |
| Average Win / Average Loss | 1.4 |
| Sharpe Ratio | 0.2784 |
| K-Ratio | 0.5855 |
| Return Retracement Ratio | 20.035 |
| Compounded Annual Return | 16.25% |
| Compounded Monthly Return | 1.25% |
| Average Annual Return | $4,729.95 |
| Average Annual Return (%) | 7.93% |
| Average Monthly Return | $727.68 |
| Average Monthly Return (%) | 1.17% |
| Percent Days Profitable | 43.87% |
| Percent Months Profitable | 76.92% |
| Percent Years Profitable | 100.00% |
| Commissions on Futures | $0.00 |
| Commissions on Currencies | $0.00 |
| Commissions on Equities | $771.14 |
| Total Commissions | $771.14 |
Rolling snapshots are far more accurate of an indicator, especially when combined, because they provide a "what if I start right now" view of strategies. This is my intend with posting this on a day-by-day entry.
Go back through older blog entries to review the consistency of the 1-year rolling snapshots.
~~~~~~~~~
As with all my ramblings, you are responsible for your own investment decisions and I am not. Please do your own diligence, and please take ownership for your actions.
Regards,
pgd
~~~~~~~~~
As with all my ramblings, you are responsible for your own investment decisions and I am not. Please do your own diligence, and please take ownership for your actions.
Regards,
pgd
No comments:
Post a Comment