Saturday, October 27, 2018

The Fisher Transform - Multi-Timeframe Entry and Exits


If you are on the blog page in a web browser from a computer, please subscribe to this using the "Follow by Email" link to the left.  If you're on a mobile device you should see something in the frame that allows you to subscribe.  Having your email helps me to notify you when Google mucks up email distribution.

~~~~~~~~~~

The Fisher Transform

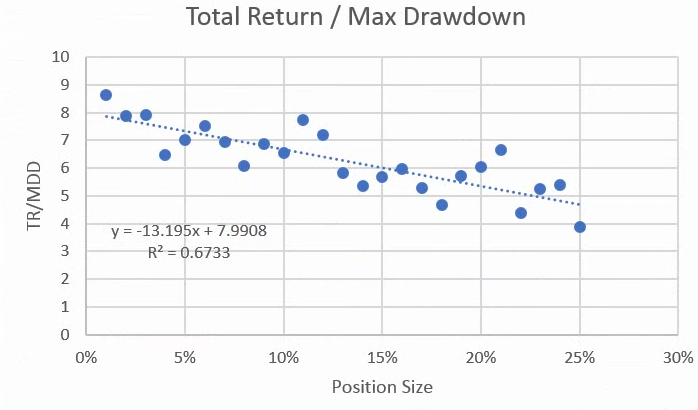
Yesterday I published results related to the impact of position sizing on your portfolio.  If you've not read this I urge you to do so; the link is here:

https://fwdtest.blogspot.com/2018/10/more-preliminary-results-fisher.html

Two days ago I published buy/sell information related to the Fisher Transform, and that link is here:

https://fwdtest.blogspot.com/2018/10/preliminary-results-fisher-transform.html

Both of these entries should be useful if you want to see how strategy development occurs in the Duncan mindset.

Today I'm going to expand on the buy/sell information that I posed earlier; here I want to qualify criteria across multiple time frames and see if the original data that I presented holds.  This is called a "sliding window" test, and it basically puts the criteria of one window against other windows, helping us to ensure that differences are highlighted.  I received an email asking about this so I thought it would be helpful for everybody to see the results.

Here is the generalized set up:
  • Sample Duration:  10 years
  • Moving Window Approach:  2002-2012, 2004-2014, 2006-2016, 2008-2018, all windows ending on 9/30 of their respective year
  • Sample Stocks:  The stocks of the NASDAQ-100.
  • Starting equity:  $100,000.00, no margin.
  • Position Size:  1% of equity, commissions & slippage not considered
  • Fisher Transform Window Size:  10 days for Daily, 5 weeks for Weekly.  I have discussed elsewhere that John Ehlers picked the 10-day window length and I've confirmed that this is the best length given multiple window tests.
  • Position entry requirement:  The close > 50d MA > 150d MA > 200d MA.  
  • Enter / exit on the next day open after the signal bar
  • If entering a position, hold it at least 1 bar to avoid whipsaws.
The test conditions are relatively straight forward:
  • Consider two time frames:  weekly, daily.
  • Enter / exit if the weekly and daily are in a particular combination of uptrend and/or downtrend
  • Enter / exit if the previous week or previous day were opposite than the current week or day, and the current week or day is in a particular known combination of uptrend or downtrend.
  • Ignore weekly conditions for the sell and just test for daily conditions to exit
When you do these various combinations you end up with 24 unique tests per window (weekly can be uptrend/downtrend, daily can be uptrend/downtrend for a total of 16 unique combinations, and if we ignore the weekly data and just re-evaluate the daily, that is another 8), 

2002 - 2012 Optimized Entry/Exit Results

Here are the top 4 results from 2002 to 2012.  The period contains a significant drawdown event in 2008-2009:

Click on the image above to enlarge.

The list is sorted from highest equity descending.  There is about a 3:1 reward/risk component, which I consider acceptable.  

The top performer contains the following rules:
  1. Enter when the WEEKLY Fisher Transform transitions from a downtrend to an uptrend AND the DAILY is already in an uptrend.  Put another way, the weekly is confirming the daily trend.
  2. Enter when the DAILY Fisher Transform transitions from a downtrend to an uptrend AND the WEEKLY is already in an uptrend.  Put another way, if the weekly is already in an uptrend and the daily has whipsawed in and out and comes back in, enter when the DAILY goes to the uptrend.
  3. Enter when the WEEKLY Fisher Transform transitions from an uptrend to a downtrend (0) and the daily is already in a downtrend.  This means that the daily has fallen and is being confirmed now by the weekly.  This is a "buy the dip" condition that we are familiar with.
  4. Enter when the DAILY Fisher Transform transitions from an uptrend to a downtrend (0) and the weekly is already in a downtrend.  This should rarely happen, since the daily should lead the weekly down.
  5. Exit criteria varies.  
    1. Two of the top 4 performers suggest that you exit when the weekly transitions to an uptrend (1) from and downtrend AND the daily was already in a downtrend (0).  
    2. The third top performer suggests that you exit when the WEEKLY transitions from an uptrend to a downtrend (0) AND the daily is an an uptrend.  
    3. The 4th top performer suggests ignoring the weekly signal (-1) and exit if the daily transitions to a downtrend (0).
All of these are plausible, so should be part of our tool kit.

2004 - 2014 Optimized Entry/Exit Results

Moving onto 2004-2014 yields the following results:

Click on the image above to enlarge.

Take a look at the right side of the figure -- it varies somewhat from 2002-2012 but if you look closer, the ordering is different but the conditions are the same.  The TOP performer maps to the second-best performer for the 2002-2012 period, but in general, the entry and exit conditions are consistent between the two window periods.


2006 - 2016 Optimized Entry/Exit Results


Click on the image above to enlarge.

Again, look at the right side of the 2006-2016 figure.  The top performer is the 0-0-1-0 sequence, which was the top performer in the 2004-2014 test window and the 2nd best performer in the 2002-2012 window.  The other three sets are the same as the previous windows too, they are just in a difference order.

Finally, to relate this to the blog entry of two days ago and using the SP 500 (recall that these tests have been with the NASDAQ-100):

2008 - 2018 Optimized Entry/Exit Results


Click on the image above to enlarge.

The top performer is the same as the 2006-2016 and 2004-2014 top performer.  All the others are present too-- just reordered.

Furthermore, this set of data matches the tests presented two days ago for the SP500.

~~~~~~~~~~

Conclusions

There are incredibly consistent results across the period 2002 - 2018.  I note the following:
  1. Although the magnitude of the portfolios varied in each 10-year moving window, the number of trades remained fairly consistent.
  2. Entering and exiting trades as listed above gives us a defined range that we should experience performance, independent of changing market conditions.  
  3. From a rational point of view, each of the different entry/exit conditions are "plausible" in that if we were simply doing ad-hoc trading we would most likely duplicate one of the entry and one of the exit conditions.  All I have done here is quantified and explicitly identified each of the conditions so that we can track them.

~~~~~~~~~~


I tackled position sizing yesterday and we established that between 5-20 positions would be ideal from a Total Return / Maximum Drawdown perspective.  I arbitrarily selected 11 positions as the go-forward portfolio size.

Additional work that follows is now to consider the use of stop losses and profit targets, and do so across a large range of trades.

~~~~~~~~~

That's all for now.  If you have questions -- ask.

~~~~~~~~~

As with all my ramblings, you are responsible for your own actions and I am not.  Nothing I've written here is advice to buy or sell any security, so don't do it unless you absolutely take ownership for your actions.

Regards,

Paul

Friday, October 26, 2018

The Fisher Transform - Impact of Position Sizing


If you are on the blog page in a web browser from a computer, please subscribe to this using the "Follow by Email" link to the left.  If you're on a mobile device you should see something in the frame that allows you to subscribe.  Having your email helps me to notify you when Google mucks up email distribution.

~~~~~~~~~~

The Fisher Transform

Yesterday I published preliminary results regarding the Fisher Transform, specifically findings around when to buy and sell.  If you did not read that entry here is the link:  https://fwdtest.blogspot.com/2018/10/preliminary-results-fisher-transform.html 

The tests provided yesterday were performed using the SP 500 basket of stocks across multiple time frames, specifically 2004-2014, 2006-2016, and 2008-2018.  I chose that basket because the number of stocks across the different periods is relatively constant; 2014 used 486 stocks while 2018 used 500.  While there may be some survivorship bias in the results it is a small portion of the total, so I'm not overly concerned.  Whether the stocks that were in the index in 2018 were in the index in 2014 is irrelevant -- I simply am trying to obtain behavior on a basket of stocks, and the SP 500 is a big basket to run tests against.

I also initially test these baskets in a way that keeps some capital in the account so that the account never runs out of cash.  This is because running out of capital (during testing) becomes a constraint on the system, and it limits the performance (or improves it, as we will see).  In either case, if we are trying to understand group behavior (e.g. how does an entry/exit signal perform using a "random" basket of stocks), then limiting that basket will also skew results.

The following figure shows the impact of undersizing each position in a basket of stocks:

Click on the image to enlarge.

As you can see in the figure above, which is a 10-year span, the test never deploys 100% of the cash -- if a stock is available to participate then it does.

Contrasting, here is what happens when you only allow 4 stocks to be part of your portfolio:

Click on the image to enlarge.

As you can see, there are discrete jumps in portfolio position size as a single issuance takes off, causing the entire portfolio to jump in value.

Position Sizing with the Fisher Transform (and in General)

Position sizing is a significant concept to grasp, because it ultimately impacts your returns.  If you have too many positions (over diversified), not only is this difficult to manage, but you literally are missing out on gains available in individual positions because your position size, relative to the portfolio, is too small.  Think mutual fund or ETF and you understand the concept.

So, what is the best portfolio sizing?

Historically, the ballpark number is between 7 and 25, but the actual number depends largely on stock selection and entry/exit criteria.  Poor exit criteria and you ride your stocks down but if you have many this may not be bad -- but if you have few it is disasterous.  Seems obvious but it is not a "one size fits all" answer.

VectorVest generally goes with 10.  This is safe but certainly not always the best.

GorillaTrades varies with an entry or two per night, and by the time you sell your initial profit target, you could be holding 25-50 small positions and this will absolutely drive you batty crazy.

Hence, the key is to find a sweet-spot in position sizing that maximizes return but minimizes drawdown (risk).

To demonstrate the procedure, the test is going to vary the position size between 1% (100 positions if all were invested) and 25% (4 positions if fully invested).  Two primary variables are to be observed:

  • Total Return (TR)
  • Maximum Drawdown
A third variable will be optimized:  the quotient of these two (TR/MDD).  This is because we want to balance reward (TR) with risk (MDD).

Here are the results:

First, Total Return (TR):

Click on the image to enlarge,

Note that between 2% and 16% (50 and 6 positions) that the total return has a tight grouping and increases as the number of positions drops (or as the position size grows).  This is what we expect -- if we have too many positions (small position size), we are overdiversified and for a large number of trades, we dilute our portfolio too much.

Also note that after 16% the variance of returns gets quite large.  This is due to the "running out of cash" constraint and means that whatever stock was available when cash became available was the next candidate.  This is a dangerous place to think you can ever duplicate the TR values, as total return in this area is completely dependent upon market conditions and whatever stock is available.  

Based on the results above I would have absolutely no fewer than 6 positions and no more than 50 positions (50 is too much, but the data is what it is).

Let's look at maximum drawdown (MDD):


Click on the image to enlarge.

Here, this shows an opposite behavior to TR:  As position size grows, maximum drawdown increases, which is what we expect.  The LESS diversified we are the more we are subjected to the individual performance of a stock, and if that stock drops, we capture more of that drop.  

As with the TR plot, we see a much wider variance above 16%, so fewer positions than 6 are not advised.  On the maximum number, it goes to reason that if we have 100 positions (1% position size) then we have maximum dilution so the drop in any one position is small, relative to the entire portfolio.  Everything checks.

Let's take a look at the ratio between the two, TR / MDD:


Click on the image to enlarge.

First of all, the downward slope of the curve fit line tells me that MDD has a bigger impact on portfolio performance than does TR.  If the line were pointing up we would want to be limiting our positions to a few (perhaps 6-10), but because it is pointing down, this is pushing us to the left, which suggests having more positions in the portfolio.

The BEST yield of TR/MDD is when there is a position size of 1% -- 100 positions in the portfolio.  My experience is that this simply is not practical.  Commissions and simple daily management are extremely difficult at this level (think Gorilla Trades).

TR tells us we want to be as far to the right as possible to maximize return.  This suggests 16% position size, but it has the worse TR/MDD ratio (as evidenced by the falling trend line).

I would compromise.  It appears, if you can stomach the drawdowns, that the position size range of 5%-15% (20 to 7 positions respectively) is not a bad place to be.  If you are a bit more conservative the number is closer to 20; if you are a bit more aggressive then you are closer to 7.

I'm going to choose a 9% position size, which will be 11 positions.  This will be a good balance going forward.

Note:  there is no "correct" answer.


~~~~~~~~~~

Additional work that follows is now to consider putting emergency stops and possible profit targets in place.  Note that I'm loathe to put a stop in any strategy, but analysis guides that outcome, not my bias.

~~~~~~~~~

That's all for now.  If you have questions -- ask.

~~~~~~~~~

As with all my ramblings, you are responsible for your own actions and I am not.  Nothing I've written here is advice to buy or sell any security, so don't do it unless you absolutely take ownership for your actions.  Please read and acknowledge the disclaimer on the upper left of the web page where you are reading this.

Regards,

Paul


Thursday, October 25, 2018

Preliminary Results-The Fisher Transform-When to Buy and Sell

.
If you are on the blog page in a web browser from a computer, please subscribe to this using the "Follow by Email" link to the left.  If you're on a mobile device you should see something in the frame that allows you to subscribe.  Having your email helps me to notify you when Google mucks up email distribution.

~~~~~~~~~~

The Fisher Transform

Much of my focus as of late has been on John Ehlers' work, specifically the art of making the Fisher Transform actionable.  If you have not been following this thread you can review the Fisher Transform here:  https://www.mesasoftware.com/papers/UsingTheFisherTransform.pdf 

Summarizing, the most common moving average method compares two moving averages, a shorter one and a longer one, and when the shorter one crosses the longer one we have a turning point.  The problem with moving averages is that they introduce lag, and hence, the longer the time frame being measured, the more lag that is introduced into the signal.

The  Fisher Transform differs from moving average methods in that it does not use moving averages -- it looks at a window of prices and based upon this window it adjusts the current price as defined by the transform. Hence, it has virtually no lag, and is very quick to identify possible turning points.  In general, it works and is quicker than moving averages and relative strength indicators, so push the "I believe button", at least for now.

As you dig into the use of the indicator you will quickly realize that there are several conditions that can occur.  For example:

  • If the Fisher Transform is in an uptrend, should I enter?  It could have been in an uptrend on the last bar also.  Is the signal too old?
  • If the Fisher Transform is in a downtrend, should I exit?  Same thought process as the previous questions.
  • If the Fisher Transform signal is new and the previous bar is opposite the new signal, is this a good entry or exit point?
The analysis gets more complicated if multi-timeframes are introduced into the mix.  For example, if I have weekly and daily bars, and run the Fisher Transform on each of these time periods, does this reduce or improve entry/exit performance?  Specifically, all the questions above apply, but now:
  • Does the state of the weekly Fisher Transform signal provide any improvement to performance?
  • What is the correct window length for the weekly Fisher Transform?  Is it the same as the daily Fisher Transform?  Does this window length materially change realized performance?
You get the idea.  Things get complicated quite quickly.

Fisher Transform Testing Results

I'm not going to give every minutia of details here but will summarize enough that those skilled in the art of backtesting should be able to approximately duplicate my results.  Here is the setup:
  • Sample Duration:  10 years
  • Moving Window Approach:  2004-2014, 2006-2016, 2008-2018, all windows ending on 9/30 of their respective year
  • Sample Stocks:  The stocks of the S&P 500.  The 2004 set of runs only utilized 486 of the possible set.
  • Starting equity:  $100,000.00, no margin.
  • Position Size:  0.5% of equity, commissions & slippage not considered
  • Fisher Transform Window Size:  10 days for Daily, 5 weeks for Weekly.  I have discussed elsewhere that John Ehlers picked the 10-day window length and I've confirmed that this is the best length given multiple window tests.
  • Position entry requirement:  The close > 50d MA > 150d MA > 200d MA.  
  • Enter / exit on the close of the signal bar
  • If entering a position, hold it at least 1 bar to avoid whipsaws.
The testing methodology tests for a number of conditions:
  • vary the weekly entry signal for both a downtrend entry as well as an uptrend entry
  • vary the daily entry signal for both a downtrend entry as well as an uptrend entry
  • vary the entry (daily or weekly) such that only enter / exit on a change from the previous state, for example, only enter if the daily/weekly meet a known condition and yesterday's daily signal was different from today's (same thing with the weekly)
  • ignore the weekly and only consider daily entry/exit signals, all within the context of change from the previous day's signal
The following is a representative equity curve and drawdown profile for one of the tests, for the period 2008-2018:

Click on the image to enlarge

This is an "okay" equity curve, but there are flat periods that would have challenged whether you stick with the strategy and sit in cash or worse yet, with a paper loss in your account.

The individual equity curves look more / less like this across all of the sample periods.  Here is the same presentation but from 2004 - 2014:


Click on the image to enlarge

You can see that the period of the 2008-9 financial crisis is relatively flat, which is an outcome of the 50-150-200d MA requirement for entry (see note at top of this post).

I stress that none of the other parameters in the account are optimized (position size, emergency stop exits, etc.) so you should not infer too much into this strategy.  For example, the strategy most likely would benefit from some sort of emergency stop:

Click on the image to enlarge

This is the Maximum Adverse Excursion (MAE) plot, which plots drawdown on the X-axis and profit/loss on the Y-axis.  Wins are cyan, losses are magenta.  A large majority of positions have some drawdown before they recover.  Some never recover.  Clearly, there are more losses below ~ 27%, so having an emergency stop in this area most likely would benefit the strategy.  

Mark that for future analysis.

Drum roll please ...

The following outcomes do not represent the highest equity peak, the highest K-Ratio, nor the highest Sharpe Ratio.  I find that zeroing in on a single parameter is a fools errand, so I tend to look for groupings of performance where each of those parameters is "in the same ballpark", and have consistent outcomes across various moving window time frames.

Click on the image to enlarge

Here's what you are looking at, left to right:
  1. Test Number:  Nothing to infer here.
  2. Total Return: Nothing to infer here either, except that there is a variance of returns.  $100K doubles the money in 10 years; $170K nearly triples the money in money in 10 years.  Rule of 72's and all of that.
  3. Trades: Fewer trades with the top performer (37), which means you probably have to have a greater tolerance for drawdown. 
  4. Avg Trade/Drawdown/Max Drawdown:  Self evident
  5. Sharpe Ratio:  in general, the higher, the better, but SR has limitations
  6. K-Ratio:  in general, the higher the better.  The larger the number the more steady the returns
  7. Total Return / Max Drawdown:  Larger is better
  8. Inputs:  Wbuy, Dbuy, WSell, DSell:  test harness conditions.  The right 4 columns break these out so I can filter.
Your takeaways are these (and I was a bit surprised):
  1. Enter when the WEEKLY Fisher Transform transitions from an uptrend to a downtrend AND the DAILY is already in a downtrend.  Put another way, do not ENTER until the WEEKLY confirms the daily downtrend.
  2.  Enter when the DAILY Fisher Transform transitions from an uptrend to a downtrend AND the WEEKLY is already in a downtrend.  Put another way, if the weekly is already in a downtrend and the daily has hung on, as soon as the daily flips to a downtrend, ENTER. 
  3. Exit criteria varies.  The "1", "-1", and "0" mean that for selling, weekly status doesn't really matter - it's the change in weekly that counts.  The weekly signals help.
  4. Exit when the DAILY signal moves to a downtrend from an uptrend.  This was common for all entry cases.  Remember -- bar count is at least 1 bar (a day), so there is no same-day selling as the day you entered.  The entry and exit signals are not in conflict.
~~~~~~~~~

I've been doing daily analysis on the Fisher Transform and I'm impressed.  It's not a holy grail, but it is pretty darn good at identifying turning points and what you should be doing with positions.

The results to date have been somewhat counter-intuitive, specifically regarding entering the position when we are transitioning to a downtrend; when I started to look at the trades it made sense if we are to capture the full range of the trend and most of the stocks are already in an uptrend.

Additionally, the selling criteria using the weekly exit signal dramatically improves returns.  Adding the selling criteria of ANY weekly transition (uptrend to downtrend or downtrend to uptrend) beat simply using the daily exit.  The table below shows a 2.6% average return for each daily exit, and a 3.2% return for each weekly exit, independent of direction of the weekly transition.

Signal Name Average of Profit(%)
DayTransExit 0.026120579
WkTransExit 0.032469279

Grand Total 0.028515908

~~~~~~~~~~

Additional work that follows is now to consider position size (what is the optimal position size?), and to look at putting emergency stops in place.  Note that I'm loathe to put a stop in any strategy, so I need to see that somehow a position is trapped and has no chance of recovery, based upon my rules, and that a back door is required.

~~~~~~~~~


That's all for now.  If you have questions -- ask.

~~~~~~~~~

As with all my ramblings, you are responsible for your own actions and I am not.  Nothing I've written here is advice to buy or sell any security, so don't do it unless you absolutely take ownership for your actions.

Regards,

Paul


Wednesday, October 24, 2018

Selling Calls in AMAT

.
If you are on the blog page in a web browser from a computer, please subscribe to this using the "Follow by Email" link to the left.  If you're on a mobile device you should see something in the frame that allows you to subscribe.  Having your email helps me to notify you when Google mucks up email distribution.

~~~~~~~~~~

AMAT

I presently hold 500 shares of AMAT and presently have no calls sold, so am looking to collect revenue in the form of premium.

AMAT is presently trading below my paper break-even level.  This suggests that the further I move away from that level, the cheaper calls become, and this means I collect less as the stock drops.  It also means that if I sell a call against my holdings that there is a non-zero chance that the stock could be called away below my basis, e.g., at a loss.  

As a result of this possibility, I tend to wait for new short-term trends to materialize before selling calls or puts.  Right now, with yesterday's action, a new short-term signal down has triggered, which means that the stock is moving away from my break even and that selling out of the money (OTM) calls most likely will expire worthless.

AMAT is quality stock but is in an industry that is getting hammered.  On a year-over-year (YOY), quarter-over-quarter (QoQ), and trailing 12-month (TTM) basis it is doing well:

Click on the image to enlarge.

Based on these values (all positive), I am continuing to hold the underlying and sell premium.  If any of these measures were to turn negative I'd look to unload the underlying.

To select the correct calls, I typically plot the bids across various option expirations (OEs):

Click on the image to enlarge.

The rows of this table are various strikes and the columns are the OE dates.  The colored portion of the table shows the annualized return on option (AROO) that is possible if the premium received is at the indicated level.

You can see that option premium peaks on 11/16, relative to today, and then falls off.  Hence, to capture the maximum amount of premium, I look to see which OE peaks for a given strike.   I've circled the 11/16 AROOs to show specifically where I'm looking in terms of maximizing my return. As it turns out all of the strikes peak in 11/16, but others also dip in the 11/23 week then start trending upwards.

Another consideration is that the closer I get to the present value, which is around $33, the greater the probability that the stock will rise to that strike value.  Because my basis is above the strike levels shown, I simply want to collect the call premium and have the option expire worthless.  

I did not show this but the $37 strike has a delta of +0.17 and a Probability of OTM of 86%, reflecting a low chance that AMAT will be called away.  This is the balance of selling premium below your breakeven.

I entered a trade to sell five AMAT 181116C37 and received $0.30, just under the desired $0.31.  If held to OE my AROO would be 13.3%.  Due to my practice of placing buy-to-close (BTC) orders, I'll most likely close the position earlier than OE and should return more than what is shown.

~~~~

That's all for now.  If you have questions -- ask.

~~~~~~~~~

As with all my ramblings, you are responsible for your own actions and I am not.  Nothing I've written here is advice to buy or sell any security, so don't do it unless you absolutely take ownership for your actions.

Regards,

Paul

Monday, October 22, 2018

Update on CSP Twitter Alerts

.
If you are on the blog page in a web browser from a computer, please subscribe to this using the "Follow by Email" link to the left.  If you're on a mobile device you should see something in the frame that allows you to subscribe.  Having your email helps me to notify you when Google mucks up email distribution.

~~~~~~~~~~

Administratia:

First of all, thank you to those of you who have sent in real $$$ to pay for the Zapier subscription.  I'm happy to state that of the $240 required for the next year I've received more than half (but less than the $240), and rather than send the money back to those that sent a check or used Paypal, I'm going to go ahead and update the subscription to start today and run for the next year.

Follow the alerts at https://twitter.com/GreekGodTrading

The restoration of the alerts does not mean that all is good -- I still need everybody who is a benefactor of my Twitter CSP alerts to show a little respect for value that you receive and send me a few bucks.  10 of you means $24/year - $2 per month.  5 of you is $4/month.   You can Venmo (https://venmo.com/Paul-Duncan-16), Paypal it to pduncan@vt.edu, or send me a note and I'll send you my mailing address.

I'm certainly not looking to make any money from you -- I just want expenses covered for a service I provide for free and that many of you have expressed that you receive benefit from.

Let your conscience decide what you should do.  For the few that have sent a few bucks -- thanks.

Send $$$!

Regards,

Paul