Friday, February 23, 2018

Feb 24 Optimized Sharpe Ratio Portfolio Update

.
If you are on the blog page in a web browser from a computer, please subscribe to this using the "Follow by Email" link to the left.  If you're on a mobile device you should see something in the frame that allows you to subscribe.  Having your email helps me to notify you when Google mucks up email distribution.

~~~~~~~

Summary

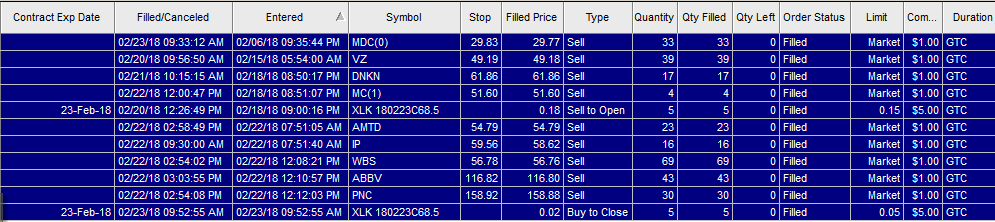
The week was a successful week overall.  DNKN, IP, MDC, VZ, and WBS were exited at losses, but gains were captured in ABBV, AMTD, MC, and PNC, resulting in a starting profit of $532.66 at the beginning of the week and ending at a total profit level of  $1024.28.  I also sold calls against the XLK position, which were bought back Friday at $0.02 each, resulting in a net profit of $70.00.  Total cumulative realized (captured) profit for the portfolio is $1,094.28, not including dividends.  This also does not include paper profits.

The non-dividend transaction log for the week is as follows:

Click on the image to enlarge.

The account has $20,267.36 in cash, the highest cash level since inception at the start of 2018.

The portfolio holds the following positions:

BHP 82
*BK 56
BLK 7
CFG 18
CFR 23
CM 20
CWT(1) 11
DRI 28
*EMR 33
GRMN 16
*HLI(0) 18
KAR 45
LVS 37
MGA 19
MNR(HB) 83
PAYX 84
RCL 27
WRK 68
XLK 569

The positions with an " * " are earmarked for sale using my standard methodology (see below) due to recent downgrade in revenue growth, earnings per share (EPS) growth, or a combination of the two as the outcome of the latest earnings reports (ER). 

Strategy / Plan for the Next Week

I'm traveling next week so my availability to work on this portfolio will be limited.

Selling:

The selling critiera mandates that I ratchet upward the sell stop on stocks on a nightly basis.  This value is never adjusted downward once a decision to sell a stock occurs.  The stock will either 1) continue upward, with nightly ratchets of the sell stop moving upwards accordingly, or 2) it will descend and hit the sell stop, triggering the exit.  The ratchet is set to 0.99 * the day's low.  That's it -- nothing special.  This method ensures that we capture any upward movement of the stock even though our longer-termed view is to not be exposed to the equity.  I have written a TradeStation indicator to make this very easy for me to manage.

Buying:

Rather than purchase positions outright, I'm going to sell slightly out of the money (OTM) puts on the positions that I want to hold for the portfolio.  I'm going to target a delta of -0.3 or smaller, but this is not a hard-fast rule.  The goal here is to collect premium to lower the cost basis, and eventually be assigned.

Mechanics:
  
Purchasing the ideal, optimized Greenfield Sharpe Ratio portfolio down to the share has worked fine and the dividend collection has worked as designed/anticipated, at least for the past 7 weeks, which included a 5% downdraft.  This being said, I'm looking to simplify.  

I note the following:
  1.  Although I've abstracted it away from you, the optimization process pointed to owning over 37 positions (recommended for the open on 2/2).  This is like owning a miniature mutual fund and is a considerable amount of work to manage.  That is the opposite direction from where I want to go.
  2.  The ideal number to own today, 2/23 close, is 25 stocks.  90% of the portfolio is contained in the top 15 stocks, with the last 10% in the last 10 stocks.  Certainly more manageable, but also still a larger number than I would like.  Some of those positions are quite small and have little impact on the overall portfolio.
With this information in tow, I've modified the process to restrict purchases to increments of 100-share lots only.  The question is "how much does this change the overall projected performance of the portfolio?"

Let's take a look at the Efficient Frontier, which is what this entire process is based upon:


The purple dot is the "optimized" portfolio configuration, down to the individual share, and the yellow diamond that is slightly to the right is the new projected portfolio with 100-share increments.  Stocks that are below this 100-share level are not funded in the new portfolio, but are tracked in the event that their weightings change as a function of time.

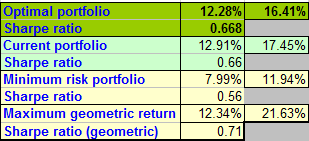
The impact in this approach is relatively negligible on a delta (difference) between the Optimal Portfolio and the 100-share increment portfolio.  In the figure below the "Current Portfolio" is the 100-share increment portfolio:


As you can see, in an ideal world the volatility is lower (16.78%) with the "Optimal Portfolio", which is what I would expect (more stocks generally dampen movement if they are loosely correlated).  For this reduction in volatility potential gain (12.72%) is lower than the 100-share increment portfolio (12.80%).

Because this is all driving with the rear-view mirror (make sure you know why), the difference between the two portfolios is insignificant.

Here's the proposed new portfolio configuration:


Contrast this configuration with holdings that I have right now in those underlyings:

XLK 569
KAR 45
CM 20
TROW (New)
WRK 68
PAYX 84
GRMN 16
GNTX (New)

New positions need to be established (TROW and GNTX), and other positions need to be built out.  I only have a bit over $20,000 cash, so I'm going to work on various combinations to deploy that capital with writing cash-secured puts.  

There will not be a significant difference in migrating to this new portfolio -- the shortest line connecting the purple dot and the yellow diamond in the Efficient Frontier (not shown --imagine it being there) is the anticipated performance between the two portfolios, so I'm not expecting any major differences while I transition from the 25+ holdings to this smaller set of stocks.

The other odd-lot positions in the portfolio will be sold as dictated by the existing sell rules.  Because I cannot write a call against them ( XLK is the only position that I hold with more than 100 shares), they will be sold using the traditional ratchet stop loss method that I described above.

Impact on Dividend Income:

A natural question that I had concerns the impact that moving to a smaller number of stocks would have on the overall generation of dividend income.  Note that the amount invested is the same, but because dividend payments are different, the impact could be significant.

I created a backtest using the Optimized Sharpe Ratio portfolio (titled "Portfolio 1"), which contains all the stocks down to the individual share ownership, a second portfolio that is the 100-share increment Optimized SR portfolio ("Portfolio 2"), a third portfolio which is a traditional income portfolio comprised of  VTSMX/13%, VGTSX/7%, VBMFX/64%, and PIGLX/16% ("Portfolio 3").  

I ran the test from February 1, 2017 to January 31st, 2018.  Here are the results:

The results show that Portfolio 1 slightly outperforms Portfolio 2 in terms of income; the actual dividends paid were $2,606 vs. $2,575 for Portfolio 2.  Portfolio 3 (the income portfolio) generated $2,216, so nearly $400 less than Portfolio 1 and nearly $360 less than Portfolio 2.

From this I conclude that Portfolio 2 -- the 100-share increment portfolio, will pay dividends at nearly the same levels as the "all-in Portfolio 1" while reducing the number of stocks that I must manage.

I also decided to compare portfolio performance over the past 12 months; here are those results:


Portfolio 1 and Portfolio 2 are virtually on top of each other, with a slight edge to Portfolio 1.  Commissions were not included so it is conceivable that the greater number of stocks would reduce the portfolio performance to that of Portfolio 2 (or lower).

I added a benchmark -- the Vanguard 500 Index -- and you can see that it lagged the performance of these stocks by a measurable amount.  

Portfolio 3 -- the income portfolio -- did not lose value, but it did not gain much relative to the other Portfolios.

From this I conclude there is no significant difference between Portfolio 1 and Portfolio 2, so the 100-share increment portfolio should perform just fine, relative to the "all in Portfolio 1".  This was also shown in the Efficient Frontier picture as well as the projected performance table.

A table of the numbers from the portfolio analysis as follows and is provided without comment:

Click on the image to enlarge.

~~~~~~~~~

My next steps are to figure out which stocks I want to write cash secured puts against.  I've done the preliminary analysis; here is the table:

Click on the figure to enlarge.

TROW and XLK offer weekly options; I've drawn a "W" at the top indicating those two as possibilities.  I like weeklies since they do not tie up capital -- the trade off is that premiums are lower.

I've also marked the row "PURCHASE DISCOUNT IF EXERCISED (%)" -- this is the amount of reduction in break-even in that stock relative to if I were to purchase it at the open Monday morning.  Selling (and collecting) premium lowers this value, which is the entire purpose of this effort.

As I stated, I do not have enough cash to sell all these options, so I have to pick and choose.  I'll decide that over the weekend.

~~~~~~~~~

As with all my ramblings, you are responsible for your own actions and I am not.  Nothing I've written here is advice to buy or sell any security, so don't do it unless you absolutely take ownership for your actions.

Also, if you have any questions, feel free to drop me a note.

Make it a great weekend!

Regards,

Paul

Thursday, February 22, 2018

Jan-Feb Earnings Cycle Not Favorable to Greenfield Leaders

.
If you are on the blog page in a web browser from a computer, please subscribe to this using the "Follow by Email" link to the left.  If you're on a mobile device you should see something in the frame that allows you to subscribe.  Having your email helps me to notify you when Google mucks up email distribution.

~~~~~~~

This earnings cycle has been hard on the Greenfield Leaders -- and I suspect more is coming.

Greenfield Leaders have a common characteristic:  they have constant to increasing revenues and earnings per share (EPS) on a quarter-over-quarter (QoQ), year-over-year (YoY), and trailing 12-month (TTM) basis.  These characteristics reveal that management is dealing with corporate growth in a responsible manner -- they are controlling expenses as revenues increase (reflected by earnings) and that they are not performing a sleigh of hand through share buybacks, etc. (which artificially increase EPS irrespective of revenues).

When a company has a dropping revenue or EPS metric something is changing:  demand is decreasing (lower revenues and/or EPS), expenses are going up (lower EPS), or some mixture of the two.  Institutional investors have confidence when these values increase year over year -- and they lose confidence when things change.

While I can tolerate decreasing revenues and EPS compared to the last quarter (many products are cyclical), I cannot tolerate decreasing revenues or EPS compared to the same quarter one year ago, nor can I tolerate a decrease in the TTM revenues or EPS.  These are all variants on cracks in the armor, and it is a matter of time before the company resets, driven largely by institutional investors allowing the prices to reset.

A number of companies in the portfolio are in trouble from a longer-term perspective:

ABBV
AMTD
BK
EMR
IP
HLI
MDC
MC

Revenues continue to look strong, for the most part, in each of these companies, but EPS metrics on the QoQ, YoY, and TTM basis are getting hammered.  As I implied above, falling EPS, in the face of rising revenues, means that management is spending more per share of share value than what they have historically been doing, and while this is part of a growth/expansion cycle, it is impossible to know whether the spending will translate into improved REV and EPS metrics.  This means that value in the stock is topping (at best), and at worse, that money will outflow these stocks, lowering the prices. Good management teams succeed -- new or bad management teams fail at this.

Given this, and the fact that there are a number of companies that are doing so well in the REV and EPS area, the stocks listed above will be slated for sale (if they are not already -- BK, MC, MDC are already on the block).  These stocks will be replaced with good stocks with solid revenue and EPS, and that are part of the Dividend Champions series (link here) in due time.   There is no rush to get rid of these stocks, especially if we're looking to collect dividends:

  • HLI is going to pay $0.20/share for record holders of 3/2.
  • ABBV is going to pay $0.96/share after 4/12.  

Everybody else has already paid us or is going to within the next week or so, and I'll tally this up at the end of the month.

We have earnings reports coming up on CM and MGA (today, before the market open) as well as CWT (March 1, before the open), and the next reports aren't until after March 20th.  I'm expecting that CM will be added to the sell list (I'm anticipating that revenues are going to fall on the QoQ and YoY metrics), and I expect MGA to be flat to slightly positive, sparing it for another quarter.

~~~~~~

For those keeping track, here are the portfolio holdings:

ABBV 43
AMTD 23
BHP 82
BK 56
BLK 7
CFG 18
CFR 23
CM(HB) 20
CWT(1) 11
DRI 28
EMR 33
GRMN 16
HLI(0) 18
IP 16
KAR 45
LVS 37
MC(1) 4
MDC(0) 33
MGA(HB) 19
MNR(HB) 83
PAYX 84
PNC 30
RCL 27
WBS 69
WRK 68
XLK 569
XLK 180223C68.5 -5

Note that I added the covered call sale in XLK just to generate a few extra premium dollars and to make up for the low dividend payments associated with XLK (dividend yield is presently 1.31%, below the risk-free-rate (RFR) of 1.34%).  The call will most likely expire worthless this Friday, adding an extra $90 to the portfolio.  We have a 4% gain in XLK with a basis at $64.41, so we're guaranteed a gain no matter what happens.  I doubt that the position will be called away.

The portfolio is approximately 97% invested, so there is not a bunch of cash sitting around.  Total "all-in" portfolio value as of this morning is $102356.86, and I have $3.1K that I could deploy to a new position.  I'm going to wait until I free up a bit more cash as I'd like to get a round 100-share lot in something so we can generate some call/write premium.  This takes a bit more capital, and it has to fit in with the Greenfield Optimized Sharp Ratio screening process, which I won't get to until this weekend.

~~~~~~

As with all my ramblings, you are responsible for your own investment decisions and I am not.  Please do your own diligence, and please take ownership for your actions.  Nothing in this blog entry is to be construed as advice to purchase or sell any security -- you follow what I do completely at your own risk.

Regards,

Paul

Sunday, February 18, 2018

Weekend Update for Feb 17 2018

.
If you are on the blog page in a web browser from a computer, please subscribe to this using the "Follow by Email" link to the left.  If you're on a mobile device you should see something in the frame that allows you to subscribe.  Having your email helps me to notify you when Google mucks up email distribution.

~~~~~~~

This is brief simply because it's an easy week to describe what is going on.

The following stocks are slated for sale due to an earnings miss (EM) or revenue miss (RM):


  • BK:  EM, sell stop @ $55.34
  • DNKN:  EM, sell stop @ $61.86
  • MC:  RM, EM, sell stop @ $51.58
  • MDC:  RM, EM, sell stop @ 29.69
  • VZ:  EM, sell stop @ 49.19
As many of you know, I've been trying to get rid of MC and MDC but have not been successful, as they never hit the stop loss ratchet.  This is exactly why I have a stop loss ratchet ...

Transactions for the week were as follows:

(click on the image to enlarge)

The portfolio is fully loaded and current holds the following positions:


ABBV 43
AMTD 23
BHP 82
BK         56
BLK 7
CFG 18
CFR 23
CM   20
CWT 11
DNKN 17
DRI  28
EMR 33
GRMN 16
HLI  18
IP      16
KAR 45
LVS         37
MC   4
MDC 33
MGA 19
MNR 83
PAYX 84
PNC 30
RCL 27
VZ         39
WBS 69
WRK 68
XLK 569

No new positions will be purchased until some cash is freed up.

~~~~~~~~

As with all my ramblings, you are responsible for your own investment decisions and I am not.  Please do your own diligence, and please take ownership for your actions.  Nothing in this blog entry is to be construed as advice to purchase or sell any security -- you follow what I do completely at your own risk.

Regards,

pgd


Tuesday, February 13, 2018

Added PNC to Holdings - COR Added to Sell List

.
Folks, a quick update here for Tuesday, February 13th.

PNC was added to the portfolio on Monday.  We bought 30 shares at a filled price of $153.23.

COR (Coresite Realty) posted "okay" numbers regarding its ER this past Thursday but EPS in the most recent quarter, compared to the same quarter one year ago, fell.  This is a strong, steady company but under the terms of the trading plan the stock must be earmarked for sale.  We do not have a big position (4 shares) so the impact is minimal.  COR's initial sell stop price is $92.49.

https://www.earningswhispers.com/epsdetails/cor

MC and MDC are still on the sell list and their sell stop prices have been ratcheted up to $51.13 and $28.77 respectively.

https://www.earningswhispers.com/epsdetails/mc

https://www.earningswhispers.com/epsdetails/mdc 

The account recovered nicely on Monday.  We are only ($423.52) below our starting Jan 1, 2018 value of $100K and ($1,075.98) below $100K + captured trades and dividends.  By comparison, the IWM (Russell 2000) is down -2.81% and the SPY (S&P 500) is down -0.56% from starting values on January 1st (link here).

~~~~~~~~

As with all my ramblings, you are responsible for your own investment decisions and I am not.  Please do your own diligence, and please take ownership for your actions.  Nothing in this blog entry is to be construed as advice to purchase or sell any security -- you follow what I do completely at your own risk.

Regards,

pgd

Sunday, February 11, 2018

Feb 11 Update for the Greenfield Optimized Sharpe Ratio Portfolio

.
If you are on the blog page in a web browser from a computer, please subscribe to this using the "Follow by Email" link to the left.  If you're on a mobile device you should see something in the frame that allows you to subscribe.  Having your email helps me to notify you when Google mucks up email distribution.

~~~~~~~

Past Transactions Since Last Report

The following transactions occured this week:


Click on the image to enlarge.

I notified the group that I was selling MDC -- the order persists, and I keep raising the sell stop loss level.  The level going into 2/12 is currently $28.13 and keeps getting adjusted upward if the price moves upward.  The level is a ratchet set to 0.99 of the day's low and is never lowered.  MDC is slowing in terms of revenues and EPS, which has triggered it for sale.

As I mentioned last week, MDC will pay $0.30/share on 2/21 for holders on 2/7.  That's us!

~~~~~~~

Newly-Identified Positions to Sell

MC, which is Moelis & Co., reported this past week and is also slowing in terms of revenues and EPS.  It too is now slated for sale, with a stop loss set at $50.59.

MC is not slated to pay any dividend any time soon, so there are no considerations there.  It was expected in January (based on a January 2017 schedule) but I've not been able to find any information on a real payment.

~~~~~~~

Newly-Identified Positions to Buy

The account has about $4,300 of cash that I am looking to deploy.  The recent downdraft has significantly impacted the number of available stocks to review; the rise of the 1-month treasury bill also makes the risk-free-rate more compelling relative to some alternatives (link here).  Volatility in all stocks has also jumped dramatically, causing the Sharpe Ratio of each stock (relative to historical performance) to drop a large amount.

This being stated, here is what I am finding as the optimum portfolio going into 2/11:


The "new" positions, relative to current holdings, are MEOH and PNC.  PNC is suggesting 30 shares at an entry of $153.15 or higher, and relative to MEOH, which is 6 shares at $56.03, completely dominates the conversation.

I've placed a buy stop loss for 30 shares of PNC at or above $153.15 for Monday and will adjust downward if the price drops and never hits the stop loss entry point.

PNC paid a dividend of $0.75/sh on 2/5 for record holders on 1/17; we were not owners so we will not receive this payment.  I expect the next payment will be declared in April and received early May if history is any indicator.

~~~~~

Performance

The current and projected stats of performance, relative to current holdings as well as optimal configuration, are as follows:


Compared to January, the expected performance of the portfolio (Optimized or Current) are significantly lower and the volatilities have moved upward, as we have recently experienced.

All of these stocks pay a steady to increasing dividend, and at the current allocations shown above, I should receive $2,827 in dividend payments on the original $100,000 invested if I hold each of the positions at least through 4 dividend payments.  This is 2.83% on a current risk-free rate of 1.32%.  I have received $47.88 in January, and am expecting the following dividend payments, totaling $124.30, in the month of February:

ABBV will pay $0.71/sh, 43 shares, $30.53 total on 2/15
BHP will pay $0.22/sh, 82 shares, $18.04 total on 2/15
PAYX will pay $0.50/sh, 84 shares, $41.00 total on 2/15
AMTD will pay $0.21/sh, 23 shares, $4.83 total on 2/20
CWT will pay $0.188/sh, 11 shares, $2.06 total on 2/23
MDC will pay $0.30/sh, 33 shares, $9.90 total on 2/21
WBS will pay $0.26/sh, 69 shares, $17.94 total on 2/27 if we are holding on 2/13

We ended the week down; the current portfolio value is $98,196.46.  We have captured $604.58 in trades and $47.88 in dividends and have a net loss of $1,803.54 (-1.8%).  As a comparison, the SPY has dropped exactly -2.00% since 1/2/18 and the Russell 2000 has dropped -3.73% (link here). 

~~~~~~~~

Summary

Onward and upward.  The portfolio is performing fine, and the amount of work to manage it is not burdensome.  It takes more to write these blog entries than it does to manage the portfolio, by far.

~~~~~~~~

As with all my ramblings, you are responsible for your own investment decisions and I am not.  Please do your own diligence, and please take ownership for your actions.  Nothing in this blog entry is to be construed as advise to purchase any security -- you follow what I do completely at your own risk.

Regards,

pgd


Tuesday, February 6, 2018

Selling MDC in Portfolio

.
If you are on the blog page in a web browser from a computer, please subscribe to this using the "Follow by Email" link to the left.  If you're on a mobile device you should see something in the frame that allows you to subscribe.  Having your email helps me to notify you when Google mucks up email distribution.

~~~~~~~

Folks, I'm on the road this week so this will be a short entry.

MDC released an earnings report (ER) a few days ago and the data has finally caught up to my dashboard.  Year over year (YoY) growth is down -24% (0.78 vs. 0.59), and YoY revenue growth is down -2% ($736 vs. $724).  Any negative YoY value means that the stock will be slated for sell.

The stock went Ex-Div today (2/6) and will pay $0.30 per share if we are on record tomorrow.  We own 33 shares so this is $9.90 in dividend income.  I want to capture the dividend payment (it's why we invest in dividend stocks) but this has to be weighed against losses when the position is liquidated.  The challenge here is that there is no correct answer.

The stop loss floor exit point for MDC is presently 0.99 of the day's low, which is calculated at $28.00 even.  It is better to forego the dividend and limit the losses for the exit strategy so I've set a stop loss to sell at $28, active after 9:40 a.m. ET.  If the stop loss is never touched we'll collect an extra $9.90 later this month; if the stop loss is touched we'll be out but with limited losses.

~~~~~~~

I am still attempting to get into BK, BLK, IP, and LVS as previously stated in my last blog.  I've been adjusting the entry point downward each day and because of recent market conditions, none has hit the 1.01% of the previous day's high threshold.  The end result is that I'm getting a better price on good stocks.  I have nearly $15K in cash in the account that needs to be deployed, and MDC will increase that by another $1K or so, hence I will revisit the preferred alignment later this weekend.

~~~~~~

As with all my ramblings, you are responsible for your own investment decisions and I am not.  Please do your own diligence, and please take ownership for your actions.

Regards,

pgd


Sunday, February 4, 2018

Jan 2018 Greenfield Optimized SR Portfolio Update

.
If you are on the blog page in a web browser from a computer, please subscribe to this using the "Follow by Email" link to the left.  If you're on a mobile device you should see something in the frame that allows you to subscribe.  Having your email helps me to notify you when Google mucks up email distribution.

~~~~~~~

This is my first update to review the January performance of the Greenfield Optimized Sharpe Ratio Portfolio.  For those of you new to this, I'm running a portfolio that started with $100,000 and will forward test whether the portfolio outperforms a simple buy-and-hold of dividend paying ETFs (providing broad diversification).  The overall objective is to produce alpha in stock ownership but also have a regular income stream of dividend payments that currently are being deposited as cash into the account.

 ~~~~~~

Background

The following is a cut/paste of my description from my 1/1 blog entry:

Since September I've been working on the development and testing of a lower-activity/interaction portfolio.  I simply do not have the time to run Connor's scans, enter trades, watch them day over day, and rinse/repeat.  I travel often, and the different time zones kill my ability to manage my accounts on a daily basis.

Yes, exposure (risk) goes up when you are fully invested.  I acknowledge this.  Volatility is a manifestation of visible risk so optimizing on risk (volatility) is one way not have a high ulcer index.

Here are the basic tenants of this Optimized Greenfield Sharp Ratio Portfolio, and all must be true at the time of purchase:

  • positive year-over-year (YoY) increase in revenues
  • positive quarter-over-1-year-ago-quarter (QoQ) increase in revenues
  • positive trailing-twelve-months (TTM) growth in revenues
  • positive revenues for the current quarter
  • positive year-over-year (YoY) increase in EPS
  • positive quarter-over-1-year-ago-quarter (QoQ) increase in EPS
  • positive trailing-twelve-months (TTM) growth in EPS
  • positive EPS for the current quarter

For those of you who have been following me for years, you should recognize this criteria as the basis of the Greenfield screen.  This criteria will (generally) keep you out of hot water, as it rejects companies who have falling revenues and are buying back their shares to increase EPS.  Rising revenues AND EPS, when brought together, cut the universe of quality companies down to about 300-400 in any one screen.

But wait!  There's more.  A few technical requirements must exist:


  • The close is above the 50d MA (price)
  • The 50d MA is above the 150d MA
  • The 150d MA is above the 200d MA
  • The 200d MA has a positive slope upward for at least the past 10 consecutive trading days
  • The average volume of the stock must be at least 150,000 shares on a 10-day average and 3-month average basis


Again, the above is taken as a refinement of my Greenfield screen.  These technicals, in combination with the revenue and EPS criteria, further reduce the scan list to 100-150 stocks at any given time.  This is quite manageable.

~~~~~~~~

Status

As of 2/4/2018, the portfolio holds the following stocks and associated shares:

ABBV 43
AMTD 23
BHP  82
CFG 18
CFR  23
CM   20
COR 4
CWT  11
DNKN 17
DRI   28
EMR 33
GLW 48
GRMN 16
HLI   18
KAR  45
MC   4
MDC 33
MGA 19
MNR 83
MSFT 25
PAYX 84
RCL  27
VZ    39
WBS 69
WRK 68

XLK  569

The account presently has a cost basis of $89,553.12 and the balance is in cash.  Total account value (realized and unrealized) is $102,728.89.  $157.25 in short-term capital gains were captured in January, as was $47.88 in dividend payments.

~~~~~~~

January Transactions

The following snapshot shows which stocks were sold in January.  Each was sold due to a disappointing earnings and/or revenues report:

Click on the image to enlarge.

Although some purchases are still pending, the following two positions were added to the portfolio this past week and used the proceeds of the previous sales:


Dividends

The following dividends were received in January:

JPM:  $0.56/share, 54 shares, $30.24
DRI:  $0.63/share, 28 shares, $17.64

Expected February Dividend Payments

ABBV will pay $0.71/sh to the account on 2/15 as we were a holder on 1/12
BHP will pay $0.22/sh on 2/15 as we were a holder on 2/1
PAYX will pay $0.50/sh on 2/15 as we were a holder on 2/1

Possible February Dividend Payments

AMTD will pay $0.21/sh on 2/20 if we are holding on 2/6
CWT will pay $0.188/sh on 2/23 if we are holding on 2/12
MDC will pay $0.30/sh on 2/21 if we are holding on 2/7
WBS will pay $0.26/sh on 2/27 if we are holding on 2/13

Possible March Dividend Payments

CFR will pay $0.57/sh on 3/15 for record holders on 2/28
GRMN will pay $0.51/sh on 3/30 for record holders on 3/15
HLI will pay $0.20/sh on 3/15 for record holders on 3/2
MNR will pay $0.17/sh on 3/15 for record holders on 2/15
MSFT will pay $0.42/sh on 3/8 for record holders on 2/15

Pending Transactions

GLW and MSFT are slated for sale.  Both reported decelerating EPS numbers in the most recent earnings reports, which is criteria for sale.  We are presently up 6% (+$133.75) in the MSFT position and this will dominate any dividend income that we could receive if we hold through the record date on 2/15.  We hold 25 shares, and at $0.42/share this is only $10.50.  I presently have a STOP LOSS order to sell 25 shares of MSFT at $90.72 and if MSFT reverses and moves higher, the order will move up accordingly (manually adjusted by me each evening).  

BLK, BK, LVS, and IP are slated for purchase.  Dividend yields are 2.04%, 1.67%, 3.84%, and 3.08% respectively. 

Earnings and Dividends of Pending Transactions
  • BLK will pay $2.88/sh, up from $2.50/sh, on 3/22 for holders on 3/7.
  • To capture BK we had to be holders on 1/30 and we were not.  It paid $0.24/sh to record holders.
  • LVS will pay $0.75/sh, up from $0.73/sh, on 3/30 for holders on 3/22.
  • IP will pay $0.475/sh on 3/15 to record holders of 2/21.
  • BLK reports earnings on 4/13 BTO
  • BK on 4/19 BTO
  • LVS on 4/25 ATC   
  • IP just reported ER and was favorable.  
Optimized Portfolio Configuration:

If you were to jump in to this portfolio on Monday, here is the intended construction, percentages, stop loss for entry, and number of shares, given a basis of $100K:


Given recent volatility and performance of these stocks, the following are target returns and volatility, with target Sharpe Ratios:


I note that this is down significantly from our original target at the beginning of January but those of you who follow this line of thinking know that we project the forward path using recent history.  Recent history is DOWN, hence forward estimates will be lower.

I also note that even with the new additions of BLK, BK, IP, and LVS, the Sharpe Ratio doesn't improve all that much.

Comparison to Benchmarks

This is where the rubber hits the road.

Three portfolio configurations are presented:
  • Portfolio 1:  An income portfolio constructed with 40% VTSMX, 20% VGTSX, 10% VGSIX, and 30% VBMFX.
  • Portfolio 2:  The actual stock targets and their optimized SR percentages at the start of this effort, as of January 2nd.
  • Portfolio 3:  The forward-looking  stock targets and their optimized SR percentages, as listed above.
  • A benchmark, which is the Vanguard 500 Index investor fund (VFINX), is also presented.
Here are the January performance numbers:


At no time during the month did any of the positions lose money relative to the initial investment, hence Stdev and Max. Drawdown are not applicable.  The Vanguard 500 index Investor (VFINX) mutual fund beat the income portfolio (Portfolio 1) in performance as well as our initial portfolio from January 2nd (Portfolio 2).  Had we owned the mixture of Portfolio 3, it would have beat all the other portfolios, but of course, this statement doesn't count because the new portfolio was constructed with perfect knowledge of past performance.  

Here are income comparisons for the period Jan 1 - Jan 31st, 2018:


It is worth noting that the software used for this does not look at the actual income streams but uses the annualized yearly yield and then backs out average monthly flows.  We only captured $47 in dividends in our first month while the software is suggesting the number should have been closer to $110.  The point of this graph is as follows:
  1. A relatively "safe" investment in income-focused mutual funds underperforms income targets relative to stocks.  The stocks we are invested in are all Dividend Challengers-Contenders-Champions, so on an income-comparison level, the same amount of money is producing a considerable amount of dividend income relative to established mutual funds.
  2. The forward-looking composition of the portfolio (yellow) produced more in income than the actual purchased portfolio on January 2nd (red).  Whether this project vs. capture continues will need to be tracked as the portfolio process matures.
~~~~~~~

Conclusions

I'm cautiously optimistic after month one.  Of course, this was an abnormal month due to market conditions, but overall, the mechanics of the portfolio seem to work and now, with the markets pulling back, we'll have some visibility into how markets perform in a down period.

It is clear to me that this approach of projecting a forward-looking optimized portfolio using past historical data has some merit, but I also see that it may underperform the benchmarks.  One month does not give us the visibility we need, so I'll continue to do this work.  I'll only stop the portfolio if it looks like the wheels are going to come off the wagon and I'm going to seriously lose money (I'm nowhere near that point yet).

~~~~~~

As with all my ramblings, you are responsible for your own investment decisions and I am not.  Please do your own diligence, and please take ownership for your actions.

Regards,

pgd