Sunday, September 30, 2018

Septermber 2018 CSP - CC Performance

.
If you are on the blog page in a web browser from a computer, please subscribe to this using the "Follow by Email" link to the left.  If you're on a mobile device you should see something in the frame that allows you to subscribe.  Having your email helps me to notify you when Google mucks up email distribution.

~~~~~~~~~~

Administratia:

Please read the previous blog entry regarding my Twitter CSP alerts.  The link is here:  https://fwdtest.blogspot.com/2018/09/csp-updates-for-friday-sep-28.html

~~~~~~~~~

Multi-timeframe uptrending stocks and ETFs have been updated for the open on Monday, October 1st, and are available here ( https://goo.gl/XZKgwY ).  The archive subfolder contains historical lists that you can review back in time and see how they would have performed going forward.

The alerts files (monthly historical as well as the alerts generated today, after market open), are available here ( https://goo.gl/WbuJhS ).  The archive subfolder contains historical alerts files that you can review.

Real-time Q&A with me, if I'm available, is through this link:  https://discord.gg/4QAUqyd This is Dr. Jeff Scott's HGSI Discord forum and it's worth your time to join (free).  I am @PaulDuncan at Discord and I typically watch the #cashsecuredputs-n-coveredcalls channel.  Come say "hello"!

~~~~~~~~~~

Theoretical 9/28 Option Expiration Performance

Here is a review of the alerts for the 9/28 OE. The following options expired out of the money (OTM), so the premium collected is ours, less commissions:

9/13/2018 ADBE 180928P252.5
9/20/2018 ALGN 180928P360
9/18/2018 ALGN 180928P370
9/26/2018 ALGN 180928P375
9/24/2018 BBY 180928P76
9/24/2018 FFIV 180928P190
9/13/2018 FIVE 180928P125
9/14/2018 GRUB 180928P136
9/24/2018 HES 180928P70
9/21/2018 LNG 180928P65
9/17/2018 NOW 180928P190
9/7/2018 PTCT 180928P41
9/6/2018 SQ 180928P80
9/12/2018 SQ 180928P85
9/17/2018 SQ 180928P87
9/25/2018 TQQQ 180928P66
9/24/2018 UCO 180928P33
9/24/2018 ULTA 180928P267.5
9/24/2018 UPRO 180928P55
9/24/2018 UPRO 180928P55.5
9/24/2018 XLNX 180928P75
9/25/2018 XLNX 180928P76

All totaled, if you collected the premium advertised at the time of the alert (not realistic unless you have a big account, e.g, about $350,000 available per week), you would have gained approximately 0.62% on the monies, or an average weighted annualized return of nearly 23.1%.  Note that the latter number isn't an exact science because of all the different dates of the alerts, and I'm not taking the time to annualize each one (although you can -- the data is in the alerts file).

Over the life of the option contract the following alerts never hit our $0.10 or $0.05 buy-to-close (BTC), and since they were in-the-money (ITM) at the close, will be assigned.  We still get to keep the premium, which goes into the general fund, and now we must sell a covered call against each of these come Monday:

FAS 180928P71
FAS 180928P73
JDST 180928P80
KMX 180928P76
LITE 180928P60
MOMO 180928P45.5

I note that LITE closed at $59.95, just $0.05 ITM.  *assigned!*

So, 6 of 28 were assigned, or about 21%.  I'm working on improving this number - the research is ongoing but is resulting in better identification of turning points and a better time to enter the write-put or write-call order.  The goal is no assignments and 100% expire worthless or hit their BTC before OE, but obviously, this is a moving target because the markets are constantly changing.

NONE of the assigned positions are lower than 7% paper loss, and the average paper loss is -2.6%.  This means that on Monday most will have a call with very high premium close to our closing strike price. 

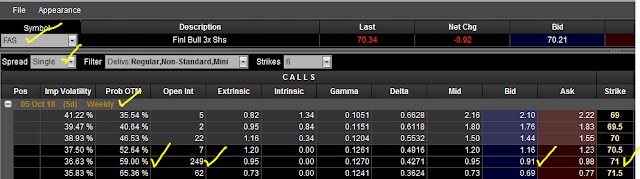
So, for example, for the assigned FAS 180928P71, I'd sell the $71 call ("breakeven strike") for 10/5 for about $0.90, which is 0.90/71 = 1.29% Return on Option (ROO) and for the 5 days next week, is 1.29 * 365 / 5 = 95% annualized return (AROO).  If it gets called we keep all of the premium and lose possession of FAS, and if it doesn't get called we still keep the premium and get to sell another call the following week.  The graphic below shows the call side of the option chain for FAS for 10/5, at the $71 breakeven strike:

Click on the image to enlarge.

I note that the actual premium received will be determined after the market opens on 10/1.  The figure above is snapped during non-market hours, so is subject to change.

Rinse, repeat.

I personally like to sell a call right at the assignment price ("breakeven strike") because holding stock is far more risky than holding a cash-secured put, and I want the equity to be called away as soon as possible.

One final thought:  On the assigned positions, I'm most likely going to BUY a PUT at the same time that I SELL a CALL.  I was just assigned a position in JDST, so let me demonstrate the thinking.

1) Find the minimum premium that I'm willing to receive for a COMBO transaction.


  • My breakeven strike is $79.00  I want this money to work for me, so I'll sell a call at this strike.
  • My target AROO is 20%.  Your actual mileage may be different.  Be realistic, and as I've proven, 20% is well within the reach of my strategy.
  • My strategy currently has a win/loss rate of 92% (and change).  I adjust the minimum premium by this so we "juice" the premium requirement by this amount to drive it upwards.  Ask if this isn't clear.
  • There will be 2 contracts, one on the call side, and one on the put side.
  • I've set a buy-to-close (BTC) of $0.05 on the call -- it is possible that if the ETF rockets downward towards my put that this could trigger.  I can turn around and sell another call if this happens (Alan Ellman's "hit a double").
  • Round trip commissions is actually just the entry commissions for both the call and the put ($1 each at TradeStation) and the called away commission ($14.95).  My expectation is to be called away and for the put to expire worthless.
  • 5 days to expiration (Mon-Fri)
  • Collect a minimum of $67 to hit at least a 20% AROO.
2) Now, go find a combo that results in meeting at least $0.67 in received premium:

When we look at the profit/loss graph, we have the following:

Click on the image to enlarge,

There's a lot of information here:
  • I can achieve approximately $0.78 collected in premium by selling the JDST 181005C79 and buying the JDST 181116P59.  This is above my minimum premium requirement of $0.67.
  • The combo lowers my exposure more than just selling the call.  The net delta (using weekend numbers and presented without proof here) is 100 (long 100 shares JDST) + (-50.2359) (short 1 JDST 181005C79) = ~49.8 and when I add the JDST 181116P59 long put (delta -14.0937) I end up with the circled -64.3296 delta adjustment, making my next exposure $35.67/contract.  This is why I keep saying that options are better than owning stock -- your exposure is less than owning the stock outright.
  • There are few nuances in the graphic.  The darker area is the 1-standard deviation move of JDST between now and November 16, which is the expiration of the put.  There is a 68% chance that JDST could fall to our put within this time.  
  • If that occurs (price falling to around $59, we'll lose money at the -$35.67/-$1 change in underlying, but the value of the put will go up at least $14/-$1.  Once the price falls enough, the put delta increase will exceed the rate at which the call is reducing, so while we will still be underwater, we'll have downside protection.  
  • While it doesn't show it in the graphic due to time value, below $59 we are completely covered in risk.
So, what is the risk profile for this strategy?  Glad you asked.
  1. Holding just 100 shares of JDST at a break even of $79 means we lose $1 for every dollar drop (-$1 / -$1) in JDST.  Conversely, we make $1 / $1 for every dollar rise in JDST.  The position delta is "100" for every 100 shares that we own.  Get used to this concept of delta.  It's really important when you own a zillion positions and want to know your portfolio exposure.
  2. If JDST closes above $79 on 10/5, the equity will be called away at $79, not including commissions.  This is the best possible case, and is the goal for any covered-call position in terms of risk reduction.
  3. If JDST closes below $79 on 10/5 but above ($79 - 0.78) = $78.22 then we make *some* money, just not our full 20% that was a our target.  The position delta (including the protective put), is somewhere between ~64 and ~86, depending upon how close to $79 we are or how close to $78.22 we are.  This is okay, because if you owned 100 shares and had zero options you would lose between $0 and $78.  Make sure you understand why, and ask if you don't understand.
  4. If JDST closes below $78.22 the call expires worthless and the put is increasing in value.  Position delta is at least 86 but is dropping (which is good) as the put value increases.  On paper you are losing no more than $86/$1 change in JDST and this rate improves (gets less) as the price drops.  We have until November 16 to keep playing with our 100 shares in JDST and have downside protection.  Remember, you pocketed $78 in selling the put/call combo, and since the put is still alive, now it's time to sell another call for 10/12.  Keep collecting premium, and enjoy the downside put protection.
You get the idea.


~~~~~~~~~~

Theoretical 9/28 Option Expiration Performance

The strategy continues to plod forward.  On a month-over-month basis, the good/bad/ugly for the entire option portfolio has the following equity chart:

Click on the image to enlarge.

So, 9-months in with real money, full visibility of what I'm doing, etc. shows that on a month-over-month basis it is possible to generate consistent income by selling cash secured puts and covered calls.  Note, a strategy adjustment was made at the end of January 2018 to account for the mistakes made in January 2018, and these changes (position size rules and rejection of emotion) have helped portfolio performance in a dramatic way.

Breaking this down by week shows a few more bumps that are not visible in the monthly:
Click on the image to enlarge.

The last week of August and the second week of September were slightly negative due to the lack of positions to take that met minimum premium as well as a few rolled positions that resulted in losses within those weeks (when you roll, you buy-to-close an existing position, and if you have to pay to BTC, you may have to give up your premium if the buy price was more than you sold the original position).

In general, I'm quite pleased with the lower-left / upper-right trajectory.  I can take a few weekly bumps, and am constantly learning how to improve.

Note:  The addition of the "buying a put" well OTM that I discussed previously with JDST is another enhancement and should also reduce risk and improve long-term performance, at minimal impact to overall profits.

~~~~

That's all for now.  If you have questions -- ask.

~~~~~~~~~

As with all my ramblings, you are responsible for your own actions and I am not.  Nothing I've written here is advice to buy or sell any security, so don't do it unless you absolutely take ownership for your actions.

Regards,

Paul

Friday, September 28, 2018

CSP Updates for Friday, Sep 28

.
If you are on the blog page in a web browser from a computer, please subscribe to this using the "Follow by Email" link to the left.  If you're on a mobile device you should see something in the frame that allows you to subscribe.  Having your email helps me to notify you when Google mucks up email distribution.

~~~~~~~~~~

Administratia:

If you have been a prior benefactor of my Twitter CSP alerts you know that your alerts have been quiet since 9/26.  This is because my subscription with Zapier to link TradeStation email alerts to Twitter has hit the maximum allowed under their free plan (100 alerts per period).  They want $240 ($20 / month payable in a yearly traunch) for 1,000 alerts per month, which is far more than we will need.

Review the past alerts by going to my Twitter alert account and judge for yourself whether this is or can be valuable to you as you navigate the CSP/CC world:  https://twitter.com/GreekGodTrading 

If you want the alerts restored then I need to collect a total, from all folks, of $240.  10 of you means $24/year - $2 per month.  5 of you is $4/month.   You can Venmo it to me here or via Paypal at pduncan@vt.edu.  If I do not receive enough monies I'll return your payment to you, less any charges (if there are any).  I'm certainly not looking to make any money from you -- I just want expenses covered for a service I provide for free (-ish) and that many of you have expressed that you receive benefit from.

If you are asking why I don't simply pay for it the answer is easy -- I already have the alerts.

Let your conscience decide what you should do.  For the few that have sent a few bucks -- thanks.  We'll see if we reach critical mass.

~~~~~~~~~

Multi-timeframe uptrending stocks and ETFs have been updated for the open on Friday, September 28th, and are available here ( https://goo.gl/XZKgwY ).  The archive subfolder contains historical lists that you can review back in time and see how they would have performed going forward.

The alerts files (monthly historical as well as the alerts generated today, after market open), are available here (https://goo.gl/WbuJhS ).  The archive subfolder contains historical alerts files that you can review.

Real-time Q&A with me, if I'm available, is through this link:  https://discord.gg/4QAUqyd This is Dr. Jeff Scott's HGSI Discord forum and it's worth your time to join (free).  I am @PaulDuncan at Discord and I typically watch the #cashsecuredputs-n-coveredcalls channel.  Come say "hello"!

~~~~~~~~~~

Premarket Alerts:

The following options are signalling a need for further review in this morning's premarket.  The opportunity that is available in these is due to higher-than-normal bid/ask premium availability, and will most likely vaporize after the open (markets are efficient).

WWE 181019P90
DXCM 181019P135
NBIX 181019P115
BPT 181019P30
CURE 181019P62
EVH 181116P25

I note that some of these options and underlyings were extremely active yesterday.  Here are the options that alerted yesterday (available in the alerts file that is linked above):

ALGN 181005P370
ALGN 181012P370
ALGN 181019P370
BPT 181019P30
BPT 181116P30
DXCM 181019P135
EVH 181116P25
MPC 181005P80.5
NBIX 181019P115
NFLX 181005P360
NFLX 181012P360
OILU 181019P57
OLLI 181019P90
SGEN 181019P75
SQ 181005P90
SQ 181012P90
SQ 181019P90
SQ 181026P90
TECL 181019P154
TQQQ 181005P66
TQQQ 181012P66
TQQQ 181019P66
WWE 181019P90

For some of these to continue for more than a day means juiced value in the option chains and as such, the underlyings are worthy of further research.

As usual, these are not recommendations to sell premium - do your homework.

Evaluating the Quality of the Alerts

A question came in last night asking how to evaluate the alerts.

A link for the alerts was provided at the top of this blog entry ( https://goo.gl/WbuJhS ).  Within that folder you will see a file "Sept_2018_Master_Alerts" or, if you're reading this after September, probably the month that we're currently in.

Copy that file to your machine.

Open it up.  The right-most column lists the option expiration date.

Pick the date you are interested in.  Since today is OE (9/28), when I use all the alerts generated for 9/28 within September (as of close of 9/27) I get the following option symbols and the first date of the alert:
9/13/2018 ADBE 180928P252.5
9/20/2018 ALGN 180928P360
9/18/2018 ALGN 180928P370
9/26/2018 ALGN 180928P375
9/24/2018 BBY 180928P76
9/24/2018 FAS 180928P71
9/24/2018 FAS 180928P73
9/24/2018 FFIV 180928P190
9/13/2018 FIVE 180928P125
9/14/2018 GRUB 180928P136
9/24/2018 HES 180928P70
9/11/2018 JDST 180928P80
9/14/2018 KMX 180928P75.5
9/13/2018 KMX 180928P76
9/6/2018 LITE 180928P60
9/21/2018 LNG 180928P65
9/18/2018 MOMO 180928P45.5
9/17/2018 NOW 180928P190
9/7/2018 PTCT 180928P41
9/6/2018 SQ 180928P80
9/12/2018 SQ 180928P85
9/17/2018 SQ 180928P87
9/25/2018 TQQQ 180928P66
9/24/2018 UCO 180928P33
9/24/2018 ULTA 180928P267.5
9/24/2018 UPRO 180928P55
9/24/2018 UPRO 180928P55.5
9/24/2018 XLNX 180928P75
9/25/2018 XLNX 180928P76

Presume you sold the contract the minute the alert was issued.

Now, take each option symbol and review the chart for the option symbol, and ask yourself the following:

  • 1) Did the option symbol touch $0.10 or $0.05 any time during the period from the original alert to today?  If the answer is yes, and you understand how to place a buy-to-close, good-til-cancelled order, then you made money.
  • 2) If the answer to 1) is "no", then look to see if the underlying is going to close today above the strike price of the option.  If the answer is "yes", then you made money.  
  • 3) if the answer to 1) and 2) are both "no", then you must either make the decision to roll today (or prior to today) or allow yourself to be assigned.  If the option underlying is a quality stock, then being assigned is not a bad thing because you can write a call against the stock position and further collect money.

So, as an example, the following symbols have touched $0.10 or below in the month of September:

SQ 180928P80
SQ 180928P85
SQ 180928P87
ULTA 180928P267.5
XLNX 180928P76
ADBE 180928P252.5
BBY 180928P76
LNG 180928P65
UCO 180928P33
FFIV 180928P190
TQQQ 180928P66
HES 180928P70
FIVE 180928P125
UPRO 180928P55

This means you would have closed out of the position with a buy-to-close order and would have pocketed 80-90% of the original premium, less the BTC and commissions.

This also means the following option contracts are still open:

ALGN 180928P360
XLNX 180928P75
ALGN 180928P370
GRUB 180928P136
LITE 180928P60
ALGN 180928P375
NOW 180928P190
UPRO 180928P55.5
FAS 180928P71
JDST 180928P80
MOMO 180928P45.5
KMX 180928P75.5
FAS 180928P73
KMX 180928P76
PTCT 180928P41

The underlyings, as of premarket this morning, are as follows:

ALGN 389.97
FAS 70.60
GRUB 139.50
JDST 82.50
KMX 73.00
LITE 61.00
MOMO 43.77
NOW 191.06
PTCT 47.06
UPRO 56.87
XLNX 79.85

Here is what this means going into OE today:

ALGN is WELL above $360 so will be out-of-the money (OTM).  Expire worthless = collect all.
FAS is just below $71, so you may be assigned, maybe not.  It looks to pin close to $71
GRUB is most likely going to close OTM ==> expire worthless
JDST is OTM this morning
LITE  is OTM this morning
MOMO is ITM this morning and may be assigned.  Good stock, sell a CC.
NOW is OTM this morning
PTCT is well OTM this morning
UPRO is OTM this morning
XLNX is OTM this morning

So, out of all the of the options that expire today, the real risk going into the open is FAS and MOMO -- every other option will expire worthless by the end of the day (OTM) or already has triggered the BTC (buy to close) order.

Remember:  my strategy has a 93% win rate.

Rinse, repeat.

~~~~~

That's all for now.  If you have questions -- ask.

~~~~~~~~~

As with all my ramblings, you are responsible for your own actions and I am not.  Nothing I've written here is advice to buy or sell any security, so don't do it unless you absolutely take ownership for your actions.

Regards,

Paul

Thursday, September 27, 2018

CSP Updates for Sep 27

.
If you are on the blog page in a web browser from a computer, please subscribe to this using the "Follow by Email" link to the left.  If you're on a mobile device you should see something in the frame that allows you to subscribe.  Having your email helps me to notify you when Google mucks up email distribution.

~~~~~~~~~~

Administratia:

Multi-timeframe uptrending stocks and ETFs have been updated for the open on Thursday, September 27th, and are available here.  The archive subfolder contains historical lists that you can review back in time and see how they would have performed going forward.

The alerts files (monthly historical as well as the alerts generated today, after market open), are available here.  The archive subfolder contains historical alerts files that you can review.

Real-time Q&A with me, if I'm available, is through this link:  https://discord.gg/4QAUqyd This is Dr. Jeff Scott's HGSI Discord forum and it's worth your time to join (free).

~~~~~~~~~~

Cash-Secured Put List Observations for Thursday, September 27th:

The market action over the last few days has forced removal of a number of candidates, relative to where we started the week.  We are down to 33 stocks and 11 ETFs as the total possible candidate list.  The individual components are provided above in the multi-timeframe list folder.

Premarket alerts that you may want to review are the following:

NFLX 181005P360, collect at least $2.15 to realize at least 20% annualized return on option (AROO)
ALGN 181005P370, $1.95, 18% AROO
SQ 181005P90, $0.97, 34%
UCO 181005P32.5, $0.35, 26%
NFLX 181012P360, $3.95, 23%
UPRO 181012P54, $0.55, 17%
EVH 181116P25, $0.75, 18%
TQQQ 180928P66, $0.25, 49%

These alerts will most likely vaporize at the open as they are the result of bid/ask values during non-trading times.  This being stated, they point to potential premium availability in the underlyings, and hence, there is juice in the chains worth capturing.

Pay particular attention to leveraged ETFs, as these will be volatile.

These are not recommendations, nor should you blindly jump into these and sell these contracts without doing your own due diligence.  Do your homework and own your decision.

Cash-Secured Put List Observations FROM Wednesday, September 26th:

A number of option symbols alerted yesterday and were sent to Twitter-land for your review (more on Twitter below):

ALGN 180928P375
ALGN 181005P375
ALGN 181012P375
ALRM 181019P52.5
BPT 181019P30
BPT 181116P30
CSOD 181019P55
EVH 181116P25
HES 181005P68
HES 181012P68
NBIX 181019P115
QLD 181019P94
TQQQ 181005P65.5
TQQQ 181012P65.5
TSCO 181026P85.5
UCO 180928P33
UDOW 181019P104
VNOM 181019P40
WWE 181019P90

All of these, if acted upon when the alert was generated, provided greater than 15% AROO if held to expiration and if they expired worthless.  The respective underlying symbols are showing increased opportunity to collect higher premium.

Again, not recommendations.  Do your homework and own your actions.

~~~~~~~~~~

Status of Twitter Alerts

My Twitter Alert feed is here:  https://twitter.com/GreekGodTrading 

My subscription with Zapier to link TradeStation email alerts to Twitter has hit the maximum allowed under their free plan (100 alerts per period).  They want $240 ($20 / month payable in a yearly traunch) for 1,000 alerts per month, which is far more than we will need.

I'm not willing to spend money on something that I have no need for.  I get the alerts (obviously), since they are running on my server.  The issue is that YOU don't get the alerts, and day-after does not make them actionable for you.

So, the ask:

I need to collect $240 total from you.  You can Venmo it to me here or via Paypal at pduncan@vt.edu.  If I do not receive enough monies I'll return your payment to you, less any charges (if there are any).  I'm certainly not looking to make any money from you -- I just want expenses covered for a service I provide for free (-ish) and that many of you have expressed that you receive benefit from.
Let your conscience decide what you should do.

A question came in over night on what is the breakdown of the Twitter information.  

Here is a typical Twitter alert:

ALGN:!P_CSP1.5. ALGN 181012P375, MinBid=$4.05, MinPrem=$293.71, Last=$393.11, AROO=23%, Prob=70%, Spread=$0.40, ROO=1.1%, Days2Exp=17, CashReqd=$37095, IVRank=11.6, StrikeInc=$2.50, Delta=-0.2390, ImplVol=0.34, TSTime=1450. 9/26/2018 2:50:55 PM

Let's break it apart:
  • ALGN:!P_CSP1.5:  Header information from TradeStation.  The symbol is ALGN, and the strategy that generated the alert is !P_CSP version 1.5
  • ALGN 181012P375:  The option symbol that meets the cash-secured-put criteria
  • MinBid=$4.05:  This is the minimum amount that you will want to receive in premium, for selling one contract, in order to meet the listed annualized return on option (AROO) value in the alert (see below)
  • MinPrem=$293.71:  This is the real-dollar-value, after commissions, adjustment for strategy parameters (win rate, buy-to-close value, etc.) that you will need to collect to hit the AROO.  The MinBid value above is the INCREMENT of bid/ask that you sell; MinPrem is the actual value, including adjustments, that you will collect and put in your bank account after the dust settles.
  • Last=$393.11:  The last trading price of ALGN at the time of the alert
  • AROO=23%:  If you get the numbers presented in the alert, this is your MINIMUM annualized return.
  • Prob=70%:  This is the Black-Scholes pricing model estimate of probability of being OTM at options expiration.  I only alert on symbols that have at least 68% ProbOTM.
  • Spread=$0.40:  The current spread between bid-ask.  I only alert if this value is less than $0.49.
  • ROO=1.1%:  Return on Option.  This is what you will get in premium divided by the option strike price less any option premium received.  The denominator is your risk; the numerator is your reward.
  • Days2Exp=17:  Days to expiration.
  • CashReqd=$37095:  This is the minimum amount you must have in your account to sell 1 contract.  This is the cash secured value of the option contract.
  • IVRank=11.6:  Implied volatility rank.  At the time of the alert, the IV of ALGN is only 11.6% of the yearly range.
  • StrikeInc=$2.50:  The next lowest strike is $2.50 away
  • Delta=-0.2390:  The greek "delta" for this option symbol is negative 0.2390.  I typically stay below the 25 delta for most of my CSPs
  • ImplVol=0.34:  Implied volatility:  34%
  • TSTime=1450:  Tradestation time that the alert was generated
  • 9/26/2018 2:50:55 PM:  Twitter date/time that the alert was posted.


If there are any questions about what to do with these alerts please post here, send me a note, or engage me at the Discord CSP-CC forum.


~~~~~

That's all for now.  If you have questions -- ask.

~~~~~~~~~

As with all my ramblings, you are responsible for your own actions and I am not.  Nothing I've written here is advice to buy or sell any security, so don't do it unless you absolutely take ownership for your actions.

Regards,

Paul

Saturday, September 15, 2018

September 15 Swing Trade Indicator

.
If you are on the blog page in a web browser from a computer, please subscribe to this using the "Follow by Email" link to the left.  If you're on a mobile device you should see something in the frame that allows you to subscribe.  Having your email helps me to notify you when Google mucks up email distribution.

~~~~~~~~~~

It's been many months since I've paid attention to this blog -- I'm very active at Dr. Jeff Scott's HGSI Discord forum ( https://discord.gg/4QAUqyd ) and there are only so many hours in a day.  Managing multiple communication paths takes a considerable amount of time, as I'm sure you are aware.

All that being said, I recently released an indicator for public testing in the Discord forum that is related to swing trading, and I wanted to document a basic understanding of how to use the indicator.  Right now the code version is SwingStop 2.1, and I reserve the right to update it without notification here.

The figure below shows a recent screen grab for the SPY:


Click on the image to enlarge.

The graphic shows two plot windows.  The top is a weekly window, and the bottom is the daily.  The indicator is adaptive and works on both time scales.  I have not tested it on longer (e.g. monthly) or intraday scales, so beware if you venture off the reservation.

For now, keep the settings to daily and weekly.

There are two indicators in each window, and you can see red/magenta crosses are on the top of the price series, typically when the series is heading downward or moving horizontally, and cyan and blue on the bottom, typically when the series is moving upward or horizontally.  The blue/cyan combination gives us an indication that the series is in an uptrend for the given interval, and the red/magenta combination tells us when the series is in a downtrend.

If you look closely, you also see periods where red is on top and cyan is on the bottom.  This is a mixed indicator, and when this occurs, it signals that a potential trend change may be in the works.  Specifically, look at the last few weeks of April (top plot) for the weekly SPY, and look at the beginning of this last week for the daily SPY.  You can see areas where red is on top and cyan is on the bottom.

Note that I suppress magenta and dark blue when this transition is occuring, as there is no additional information to be gleaned.

In the normal course of movement, the following will be apparent, independent of the window being daily or weekly:

  1. If in an uptrend (blue/cyan on the bottom), as the price series moves upward, the stop also ratchets upward as gains are made.  The cyan stop is more aggressive than the blue stop (e.g. the blue stop is tighter), and both are tied to average true range and fast/slow stochastic calculations.
  2. If in an uptrend and the low of the bar cuts through one of the blue/cyan stops, the system will toggle to an intermediate or mixed condition (cyan on bottom, red on top) or will flip to a downtrend condition (both red and magenta on top).
  3. If in a mixed condition with red on top and cyan on the bottom and the price cuts through the red stop (e.g. a bullish move), the system will indicate a full uptrend (cyan and blue on the bottom).
  4. If in a downtrend and the high of the bar cuts through one of the red/magenta stops we'll enter the intermediate or mixed state (red on top and cyan on the bottom), and potentially a new uptrend state (cyan and blue on the bottom).  
  5. The indicator uses intraday data, so it is possible to start the day in one state and transition to another state by the end of the day.  This can impact your entry/exit plans.
Knowing this, take a look at various symbols in uptrends, downtrends, and range bound so that you can get a feel for what you are seeing.  It should make sense - no real rocket science here.

~~~~~~~~~~

Intuitively, if the longer-termed weekly indicator has blue/cyan on the bottom it would make sense that we're enabling entry on the daily chart (somewhere), so that we can participate in the uptrend.  It also goes to reason that if the longer-termed weekly indicator has red/magenta on the top of the price series that we probably are in a downtrend and we do not want to be long the equity.

If this is your intuition about the indicator then you have a basic understanding of what is going on.


The primary challenge is determining the best entry/exit points for the indicator.  I'm not talking about optimization -- there is nothing to optimize here, per se -- I'm simply stating that there are conditions that are favorable for entry and exit of a position, and because there are known states to the indicator, we should be able to get a sense of what works best.

The remainder of this blog entry discusses how you should be thinking about entries and exits.

~~~~~~~~~

There are four indicators across the daily and weekly presentations:  two are associated with the daily bar interval, and two are associated with the weekly bar interval.

As previously discussed, we can be in an uptrend on the daily and weekly charts, a downtrend, or mixed/intermediate trend.  Behind the scenes we can either have cyan/bottom red/top or blue/bottom and magenta/top, but I suppress the blue/magenta intermediate signal as it doesn't add any more visual information to the plot.  It *does* add information though to the evaluation.

There are two actions we need to evaluate:  entry ("buy to open") and exiting ("sell to close").   This throws in two more states.

When you mix all of this together, there are a considerable number of possibilities to consider -- 256 to be exact.  I had to devise a way of uniquely identifying each of the states.

What I came up with is straightforward:  
  1. Let a downtrend be indicated by -1, and let an uptrend be indicated by +1.
  2. There are are a total of 4 indicators, two for the weekly, and two for the daily.  Let the daily indicators be p1 and p2 and the weekly indicators be q1 and q2.
  3. You can buy, and you can sell. So, we have p1b, p2b, q1b, q2b, p1s, p2s, q1s, and q2s.
When you create the table you'll see that it is 8 columns by 256 rows.  I'll save you the details, but a row of that table represents any arbitrary state of a complete buy/sell transaction.  You name a given buy state and a corresponding sell state and I can point to it on the table.

When you "sum" a row -- add up all of the individual "-1" or "+1" values, you get a range of values that span even numbers from -8 to +8.  Again, I'll save you the details -- just push the "I believe" button.

~~~~~~~~~~~

I created a 12-year backtest with the SPY, 12 years so that it includes the 2007 - 2009 time frame.  What I wanted to see what various returns were over this period of time given all of the different combinations of buying and selling.

The initial conditions were as follows:
  • $100K starting portfolio
  • Only trade the SPY
  • Buy the next morning open on a given entry condition, and sell the next morning open on a given exit condition
  • Do not exceed equity of 1.0 (use no margin)
The results are as follows:


The x-axis is the "summation" of the states of a row.  For example, the entry/exit summation state that corresponds to 

p1b=1,p2b=-1,q1b=1,q2b=-1,p1s=-1,p2s=1,q1s=-1,q2s=1
sums to 0.

This row that I presented above, in fact, is the top dot on the x=0 line (Total Return = $183K).

You get the idea.  If not, ask.


If you take a closer look at the graphic above, you see that equity is below zero for many of the combinations.  This isn't good.  It basically is stating that those entry/exit combinations, repeated over and over for 12 years with the SPY, produced a negative return to the portfolio.

We want to avoid those sequences.  Let's ponder:

It should be readily apparent that if the entry conditions are the same as exit conditions, we'll immediately churn the account, as the same signal that indicated to enter will be the same signal that causes us to exit.  We want to avoid situations where the buy-side state is the same as the sell-side state.

Reducing the set of conditions where buy-side equals sell-side produces the following graphic:


Each of those dots represents a losing portfolio where the buy-side conditions were the same as the sell-side conditions.  In fact, every single row is a losing row.  Out of the 256 possible states, there are 16 that are duplicates and those will be removed from evaluation.  

There were more negative values than 16 though, so we need to keep digging.

I'll save you the details of the progression to reject the negative portfolio returns, and present you with the results.  The high-level summary is this:
  • p1b = p2b, that is, during a buy sequence, we want the daily indicators to both be the same.
  • q1b = q2b, that is, during a buy sequence, we want the weekly indicators to both be the same.
  • p1s <> p2s, that is, during a sell sequence, we want the daily indicators to BE DIFFERENT.
  • we don't care about the state of q1s or q2s, per se.
The return graph for the set of conditions looks like the following:


So, a few comments about this set of results.
  1. "Confirm" does not mean uptrend or downtrend, it means that p1b=p2b and q1b=q2b. The state of these indicators could be +1 (uptrend) or -1 (downtrend), so both states apply.  What is important is that they are the same on the daily or weekly.
  2. "Different" for the sell side daily indicators is that p1s <> p2s.  p1 could be in an uptrend, which would force p2 to be in a downtrend, or visa versa.  If they are different after you enter, sell.
  3. None of the remaining entry/exit setups produce a negative total return for the SPY taken across 12 years of data.
We could stop right here and most likely have a positive edge using the SwingStop indicator, simply applying the following:
  • p1b = p2b, that is, during a buy sequence, we want the daily indicators to both be the same.
  • q1b = q2b, that is, during a buy sequence, we want the weekly indicators to both be the same.
  • p1s <> p2s, that is, during a sell sequence, we want the daily indicators to BE DIFFERENT.
  • we don't care about the state of q1s or q2s, per se.
The reason I think this works is that we are waiting for a confirmation in either direction to buy on both the weekly and daily time scales, and then we exit once we see the deviation on the daily time scales.   

~~~~~~~~

If you want further refinements, read on.

Extra Credit for The Geeks Amongst Us

For the geeks amongst us, the state table that produced the previous graphic is as follows, with highest portfolio gains at the top and lowest gains at the bottom:

p1b=(-1),p2b=(-1),q1b=(-1),q2b=(-1),p1s=(-1),p2s=1,q1s=(-1),q2s=(-1)
p1b=1,p2b=1,q1b=(-1),q2b=(-1),p1s=1,p2s=(-1),q1s=1,q2s=(-1)
p1b=(-1),p2b=(-1),q1b=(-1),q2b=(-1),p1s=(-1),p2s=1,q1s=1,q2s=1
p1b=1,p2b=1,q1b=(-1),q2b=(-1),p1s=(-1),p2s=1,q1s=1,q2s=(-1)
p1b=(-1),p2b=(-1),q1b=(-1),q2b=(-1),p1s=1,p2s=(-1),q1s=(-1),q2s=(-1)
p1b=1,p2b=1,q1b=1,q2b=1,p1s=(-1),p2s=1,q1s=1,q2s=1
p1b=1,p2b=1,q1b=1,q2b=1,p1s=(-1),p2s=1,q1s=(-1),q2s=(-1)
p1b=(-1),p2b=(-1),q1b=(-1),q2b=(-1),p1s=1,p2s=(-1),q1s=(-1),q2s=1
p1b=1,p2b=1,q1b=(-1),q2b=(-1),p1s=(-1),p2s=1,q1s=1,q2s=1
p1b=(-1),p2b=(-1),q1b=(-1),q2b=(-1),p1s=1,p2s=(-1),q1s=1,q2s=(-1)
p1b=1,p2b=1,q1b=(-1),q2b=(-1),p1s=(-1),p2s=1,q1s=(-1),q2s=(-1)
p1b=1,p2b=1,q1b=(-1),q2b=(-1),p1s=1,p2s=(-1),q1s=(-1),q2s=1
p1b=(-1),p2b=(-1),q1b=(-1),q2b=(-1),p1s=(-1),p2s=1,q1s=1,q2s=(-1)
p1b=(-1),p2b=(-1),q1b=1,q2b=1,p1s=(-1),p2s=1,q1s=(-1),q2s=(-1)
p1b=1,p2b=1,q1b=1,q2b=1,p1s=1,p2s=(-1),q1s=1,q2s=(-1)
p1b=1,p2b=1,q1b=(-1),q2b=(-1),p1s=(-1),p2s=1,q1s=(-1),q2s=1
p1b=1,p2b=1,q1b=1,q2b=1,p1s=(-1),p2s=1,q1s=(-1),q2s=1
p1b=(-1),p2b=(-1),q1b=(-1),q2b=(-1),p1s=(-1),p2s=1,q1s=(-1),q2s=1
p1b=(-1),p2b=(-1),q1b=1,q2b=1,p1s=(-1),p2s=1,q1s=(-1),q2s=1
p1b=(-1),p2b=(-1),q1b=1,q2b=1,p1s=(-1),p2s=1,q1s=1,q2s=(-1)
p1b=(-1),p2b=(-1),q1b=1,q2b=1,p1s=1,p2s=(-1),q1s=1,q2s=(-1)
p1b=1,p2b=1,q1b=1,q2b=1,p1s=(-1),p2s=1,q1s=1,q2s=(-1)
p1b=1,p2b=1,q1b=1,q2b=1,p1s=1,p2s=(-1),q1s=(-1),q2s=1
p1b=1,p2b=1,q1b=(-1),q2b=(-1),p1s=1,p2s=(-1),q1s=(-1),q2s=(-1)
p1b=(-1),p2b=(-1),q1b=1,q2b=1,p1s=1,p2s=(-1),q1s=(-1),q2s=1
p1b=(-1),p2b=(-1),q1b=(-1),q2b=(-1),p1s=1,p2s=(-1),q1s=1,q2s=1
p1b=1,p2b=1,q1b=1,q2b=1,p1s=1,p2s=(-1),q1s=(-1),q2s=(-1)
p1b=(-1),p2b=(-1),q1b=1,q2b=1,p1s=1,p2s=(-1),q1s=(-1),q2s=(-1)
p1b=(-1),p2b=(-1),q1b=1,q2b=1,p1s=(-1),p2s=1,q1s=1,q2s=1
p1b=1,p2b=1,q1b=1,q2b=1,p1s=1,p2s=(-1),q1s=1,q2s=1
p1b=(-1),p2b=(-1),q1b=1,q2b=1,p1s=1,p2s=(-1),q1s=1,q2s=1
p1b=1,p2b=1,q1b=(-1),q2b=(-1),p1s=1,p2s=(-1),q1s=1,q2s=1


There are 32 rows, or separate entry/exit conditions out of 256 total that produces positive returns using the SPY over a 12-year period.

I've colored the entry conditions where some form of downtrend exists at entry time.  The color coding is as follows:
  • Magenta, or the purple looking color, reflects just the daily being in a confirmed downtrend (p1b = p2b = -1) and the weekly being in a confirmed uptrend (yellow, q1b = q2b = +1).
  • Red, or the red looking color (!), showing that both the daily and weekly are in a downtrend (p1b = p2b = q1b = q2b = -1)
  • Dark Red, or the brownish looking red, showing that just the weekly is in a downtrend (q1b = q2b = -1) but the daily is in an confirmed uptrend (cyan, p1b = p2b = +1)
There are also instances where the entry conditions are in some form of uptrend at entry time.  This is the green coded entry.

The tally:
  • There are 8 instances where the daily and weekly are confirming a downtrend for entry (red)The average portfolio gain for these runs is $106K.
  • There are 8 instances where the daily is in an uptrend (cyan) and the weekly is in a downtrend (dark red).  The average portfolio gain for these runs is $90K.
  • There are 8 instances where the daily and weekly are confirming an uptrend for entry (green).  The average portfolio gain for these runs is $77K.
  • There are 8 instances where the daily confirms a downtrend for entry (magentabut the weekly is an in uptrend (yellow).  The average portfolio gain for these runs is $58K.

From this I conclude that: 
  1. the most psychologically difficult time, when both the weekly and daily are in a downtrend, is the best time to buy with this indicator (red).
  2. the next most advantageous time to buy is when the weekly is still bearish yet we see some confirmation of a new uptrend on the daily (dark red/bearish and cyan/new uptrend).
  3. the next, but not last advantageous setup is where both the daily and weekly are in an uptrend (green).
  4. the least advantageous, but still with a positive expectation period, is when we are in an uptrend and we have a confirmed pullback (yellow & magenta).
I'm somewhat surprised that the daily downtrend in the midst of a weekly uptrend is last in performance on the list (last of the good performance, that is).  I suspect this is because much of the gains have been attained, but I am unsure to the exact cause.

Now, from a practical viewpoint, I simply do not know how I can do 1. (entry when both daily and weekly are in a confirmed downtrend).  I note that the SPY has been in an uptrend for a long time so ensuring that the underlying stock is in a long-term uptrend most likely is a valid criteria.  I do think I can start with 2. (entry on the daily but longer-termed downtrend), with limited capital committed up front.  

Obviously, food for thought.

~~~~~

That's all for now.  If you have questions -- ask.

~~~~~~~~~

As with all my ramblings, you are responsible for your own actions and I am not.  Nothing I've written here is advice to buy or sell any security, so don't do it unless you absolutely take ownership for your actions.

Regards,

Paul