Thursday, January 25, 2018

Sell Signal Triggers for 1/25

.
If you are on the blog page in a web browser from a computer, please subscribe to this using the "Follow by Email" link to the left.  If you're on a mobile device you should see something in the frame that allows you to subscribe.  Having your email helps me to notify you when Google mucks up email distribution.

~~~~~~~

Three companies are slated for sale in the portfolio due to negative earnings growth relative to prior quarters.  Note that this is *growth*, not the raw numbers.  The companies are:

JPM
ROK
STT

JPM has been on the radar for a couple of weeks and has been a a tear since it reported earnings.  The ratchet-method that I use to get out of a stock has been applied here and works well -- you can see that as the stock has advanced the stop-market sell ratchet keeps catching the gains and as a result, I'm still holding:


Selling Rationale

JPM EPS dropped -37% on a YoY basis. 

ROK has slowed -19% in trailing twelve-month EPS values, which is a criteria for sale.  STT had a bad quarter compared to the same quarter a year ago, reporting a 30% drop in EPS relative to the same quarter a year ago, also triggering sale.

Dividend Impact

JPM went xDiv on 1/4, record date of 1/5, and a pay date of  1/31.  I am expecting $0.54/share.  We bought JPM on 1/3.

ROK ownership is outside the xDiv and record dates so we expect no dividend payment.

STT ownership was just after the xDiv and record dates, so again, we expect no dividend payment.

Replacement Positions

I've removed buy orders for replacement purchases; as cash is freed up I will post new screen outputs and rationale why new positions are being added.

Performance to Date

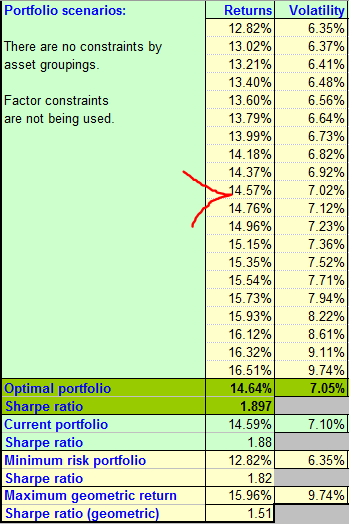
Open profit on the account ($98K invested) is $4.8K, as of 10:25 a.m. ET the morning of 1/25.  This could all vaporize with a significant down day, but part of the portfolio construction concept (optimize Sharpe Ratio) maximizes return vs. volatility ratio, so the overall portfolio should be less volatile than the market.  Because this is driving via the rear-view mirror, there is no guarantee that this will actually be the case.  The exponentially-weighted volatility/beta calculation is 1.2, meaning that if the benchmark S&P 500 is 1, the existing portfolio is expected to vary 20% more than the volatility of the S&P 500, and this could be either up or down in performance.

Using the most recent rear-view-looking data, the existing portfolio holdings are projecting a 14.12% return with 8.6% volatility, resulting in a most recent holding (non-optimized) SR of 1.50.  The 14.12% expected return is on a baseline of 12% for the S&P 500, so the expected alpha is ~ 2.12% (or so).

Onward and upward....

~~~~~~~~~

As with all my ramblings, you are responsible for your own investment decisions and I am not.  Please do your own diligence, and please take ownership for your actions.

Regards,

pgd

Wednesday, January 17, 2018

Greenfield Optimized SR Status into Wednesday, January 17

.
If you are on the blog page in a web browser from a computer, please subscribe to this using the "Follow by Email" link to the left.  If you're on a mobile device you should see something in the frame that allows you to subscribe.  Having your email helps me to notify you when Google mucks up email distribution.

~~~~~~~

The position in APO was exited at 1/16/18 12:46 pm ET with a stop market trigger of $35.58 and a filled price of $35.55.  The basis was $34.66 so there was a slight gain on the position.  To recap, this position was exited because I missed that APO had decelerating dividends, not steady to increasing -- it simply did not belong in the portfolio.

JPM still has an order for sale pending.  The stop market trigger has been raised to $109.96, having never touched the lower trigger during the day.  The position will be active after 9:40 a.m. Wednesday.  JPM is being sold because the latest earnings release printed numbers that show EPS QoQ growth, compared to the same quarter 1 year ago, has slowed by -37%.  Seeing this visually is easy if you have TradeStation and my DuncanRadar indicator.

Because of the available cash in the account I decided to run the numbers again and see whether there are any new positions that are of the size that would fit into a purchase.  Here is the new, idealized portfolio:


I've highlighted PNC because the new composition (without JPM and APO) indicates that a 2.5% position in PNC is in order.

PNC just reported earnings on 1/12 and has a "green light" across the board.  The stock is also a Dividend Challenger, meaning that it has paid consistent or increasing dividends for at least the last 5-9 years.  Dividend yield is 2.08% as of 12/31/2017.

At the present portfolio value a 2.5% position in PNC equates to 16 shares at a stop market entry of $155.05, so here's the order:


Click on the image to enlarge.

This is a OSO -- Order Sends Order -- so JPM is the parent order (it executes first) and then the PNC order will be sent.  This is a margin account so the funds obligated to JPM will be immediately available when it is sold for the purchase in PNC.  PNC will be bought if PNC is at or above the stop market price of $155.05.

Of course, if JPM does not trigger the position in PNC will not be exposed.  Hence, this requires that tomorrow we rinse and repeat the process until JPM and PNC trigger.

Next on the list will be BLK -- Blackrock "A" shares -- but I do not have enough cash in the portfolio until I free up a total of about $1,700.  BLK will have to wait for another day.

That's it for today.

~~~~~

As a reminder, CFG reports Friday before the open at 6:30 a.m. ET.

It is also possible that COR will pay their dividend today and that STT will pay tomorrow.  We were not share holders as of the ExDiv dates (12/28 and 12/29 respectively) so while the price will drop, we will not see the deposits.   The first dividend payment that I am expecting is DRI, which went Ex on 1/9 and has a pay date of 2/1.  This will be followed by ABBV (Ex 1/11, pay 2/15).

~~~~~~~~~

As with all my ramblings, you are responsible for your own investment decisions and I am not.  Please do your own diligence, and please take ownership for your actions.

Regards,

pgd

Tuesday, January 16, 2018

Greenfield Optimized SR Status into Tuesday, January 16

.
If you are on the blog page in a web browser from a computer, please subscribe to this using the "Follow by Email" link to the left.  If you're on a mobile device you should see something in the frame that allows you to subscribe.  Having your email helps me to notify you when Google mucks up email distribution.

~~~~~~~

Good morning all.  This is an update on the Greenfield Optimized Sharpe Ratio Portfolio that I started publishing at the start of the year.

Here's the account status:


About 1.6% is in cash -- all the rest is invested in dividend-paying stocks.  The current holdings and unrealized profits/losses are as follows:


JPM reported a 1% change in EPS on a YoY basis and a 3% change in a TTM basis, but quarterly EPS change compared to the same quarter dropped -37%.  This drop in EPSQtr-1y change triggers a sell for JPM.

Here is the current schedule of earnings releases that I am watching:


As you can see, CFG is up to report this week.

~~~~~~~~~

Something did pop up on my radar which could trigger a sell signal for an individual stock.  It appears that APO has decreased their dividend payment, which is something I missed in the original screen.  Here is the confirming link:

http://www.nasdaq.com/symbol/apo/dividend-history

Consequently, APO will be marked for sell, as this violates one of the basic tenants of the portfolio that dividend income will be constant to improving on a YoY basis.  Not catching this is my mistake.

Selling a Position

1.  All orders will be time-activated after 9:40 a.m. ET.
2.  If evaluating in the evening after the market close or prior to the next day's open, take the day's low and multiply by 0.99.  This is the stop loss trigger.
3.  Enter a stop loss order for the trigger level for the particular equity.

In this example JPM's SL trigger is $109.73 and APO's SL trigger is 35.58.

These values will change daily.  They will NEVER go down; only adjust upward.  Effectively, you are trailing a rising stock until it ceases to rise.

Adjust nightly until the positions are exited.

Done.

~~~~~~~~~

As with all my ramblings, you are responsible for your own investment decisions and I am not.  Please do your own diligence, and please take ownership for your actions.

Regards,

pgd

Saturday, January 6, 2018

Greenfield Optimized SR Status into Monday Jan 8

.
If you are on the blog page in a web browser from a computer, please subscribe to this using the "Follow by Email" link to the left.  If you're on a mobile device you should see something in the frame that allows you to subscribe.  Having your email helps me to notify you when Google mucks up email distribution.

~~~~~~~

Friday's action took my invested positions to a bit over 97%, so from this point forward it is simply a matter of getting the remaining 3% (or so) invested as conditions permit.  Here's what filled on Friday:

Click on the image to enlarge.

Note that I made a mistake in order entry and I specified "PM" instead of "AM", resulting in loss of the standard 10-minute-buffer between open and when I like to activate my trades.  The trades became valid at 9:40:05 PM THURSDAY night because I entered the orders Thursday night, which means they were visible immediately at the open.  Not a big hit, but not great either.  Attention to detail....

Re-running of the optimization produces the following target portfolio:


Yellow refers to positions that I hold, and the 3 remaining positions to fill are at the bottom.  Additionally, I do not have exactly the allocations shown, so my orders for Monday will "true up" the portfolio to align with the target.  Here are the trades for the remaining positions (0.09% in PKG is too small) and for the "true up":


True-up investments:

Click on either image to enlarge.

If all of these fill I will be at 100% invested, according to the target portfolio shown above in yellow.

The new efficient frontier and my current position with this composition of stocks is as follows:


The present portfolio is the yellow diamond and the target portfolio optimized Sharpe Ratio is the purple dot at the intersection of the straight line and the blue efficient frontier.  Note the scales -- I'm really close, so for the most part, this is immaterial.

The numbers on the target portfolio versus where I am presently sitting is as calculated:


Basically, the SR's are equivalent, so all I am attempting to do is deploy $3,000 to take my position to a fully-invested status.  The historical performance of this portfolio gives a reasonable expectation that 14% return at a very low volatility is achievable.  The SR of 1.89 is notable.

Because most of these stocks are part of the Dividend Champion series from David Fish ( http://www.dripinvesting.org/tools/tools.asp ), I have every expectation that income from this portfolio (which is not included in the return numbers) will be as good as or better than 2017.  One of the criteria of selling is that the dividend is cut, so if that occurs, the position will be sold and replaced with a better performing position.  Here is the 2017 performance of this fully-invested position, had I held it for all of 2017:


Portfolio 1 is this Greenfield Optimized Sharpe Ratio Portfolio, in the allocations shown above, and Portfolio 2 is a simplified portfolio comprised of the following mutual funds and their allocation:


Note that this list and composition of an income portfolio is somewhat arbitrary but produced 8.34% CAGR at a standard deviation (volatility) of 1.31%, yielding a SR of 5.41 in 2017, with only 0.18 correlation to the S&P 500 market.  The point is that I am seeking a portfolio with capital appreciation at a risk-adjusted holding level that produces more guaranteed income than a risk-adjusted income portfolio.  If you know of other methods to accomplish this please let me know in the comments section below -- I'd love to learn what you are proposing.

I note that the portfolio is presently holding $1,805.86 in net gains, just from these 4 days of trading -- the new year has started off with a bang.  I note that at any given time the combined Value at Risk (VaR) and Conditional VaR are about $3,700, meaning, that with my setup there is a 5% chance on any given day that the portfolio value could fall this amount.  Hence, $1800 paper gain could be wiped out with a 5% chance of occurance on Monday, and it could happen again on Tuesday, Wednesday, etc.  There are no stops in the portfolio, as these decrease performance over the long haul.

So, the net of all of this is that I think I'm on my way to showing how this portfolio does in 2018 with the approach.  It took 4 trading days to get to 97% investing level, and the stocks are all considered quality stocks that pay a constant or increasing dividend on a year-over-year basis.  

The first opportunity to consider the sale of a position will come with JPM, which reports earnings on 1/12 before the open.  If either EPS or revenues are showing negative on a QoQ or YoY basis, the position will be tagged for sale.

Also note that if any position has the 50d MA crossing the 150d MA or the 150d MA crossing the 200d MA from above  then the position will also be sold, as these situations negate the original conditions at the time of purchase.

Finally, realize that if any dividend is cut or otherwise lowered, the position will be tagged for sale, as this violates the original screening criteria.

~~~~~~~~~

As with all my ramblings, you are responsible for your own investment decisions and I am not.  Please do your own diligence, and please take ownership for your actions.

Regards,

pgd


Friday, January 5, 2018

Status into Jan 5 Open

.
If you are on the blog page in a web browser from a computer, please subscribe to this using the "Follow by Email" link to the left.  If you're on a mobile device you should see something in the frame that allows you to subscribe.  Having your email helps me to notify you when Google mucks up email distribution.

~~~~~~~

It is likely that I am nearing the end of the purchase sequence.  A number of entries filled on Thursday:


This series of purchases has taken me to about 89% invested; it is quite possible that if everything fills today we will see my test portfolio fully invested near 99.5%.  Here are new orders that should help complete me today:


The astute among you will notice that this doesn't total ~$10K.  As the process of buying and optimizing has occurred, the mixture has increased present holdings a small amount from the initial purchases.  Hence, I'm adding to some positions to complete the portfolio:


If all of these fill near the prices indicated they will (between the two lots) add $10.3K to the portfolio and will take me to a bit under $100K.

The majority of the work is now done, and it's a matter of management of the positions.

The target portfolio, with allocations, is as follows:


 The "yellow" is what I presently hold and "green" is what will be purchased today, not counting the slight adjustments to the existing positions.

The target efficient frontier is as follows:


You can see that the present holdings (yellow diamond) and the optimum target portfolio are close -- very close.  We're almost there.

The numbers on the portfolio, if the past is any indication of future performance (no guarantees there), are:


The target SR is 1.897 and I'm sitting at 1.88, and you can see that today's additions will only move me a few hundredths of a percentage point in annualized gain -- it's really in the noise.  All I'm doing is maximizing the amount of capital deployed -- in the end the majority of the work with portfolio composition has been completed.  14% return on $90K is different than 14% return on $100K....

My next entry will most likely be after JPM reports, which is my first earnings report associated with my holdings.  This is the only thing that could trigger a rebalance or sell of the JPM position, as the purchase criteria could potentially be violated, triggering an evaluation.

JPM reports before the open on Friday, January 12th.

Income for the portfolio, as I expect the numbers of 2017 to apply here in 2018, are as follows:

Portfolio 1 is the Greenfield Optimized SR portfolio, fully invested to the levels indicated, and Portfolio 2 is the same portfolio as shown yesterday.

~~~~~~~~~

As with all my ramblings, you are responsible for your own investment decisions and I am not.  Please do your own diligence, and please take ownership for your actions.

Regards,

pgd

Thursday, January 4, 2018

Optimized Greenfield SR Trades for Jan 4

.
If you are on the blog page in a web browser from a computer, please subscribe to this using the "Follow by Email" link to the left.  If you're on a mobile device you should see something in the frame that allows you to subscribe.  Having your email helps me to notify you when Google mucks up email distribution.

~~~~~~~

I continue to work on filling the portfolio with trades.  76% of the portfolio is obligated, with the following positions and sizing presently being held:


Click on the image to enlarge.

A number of orders did not fill because they did not take out the previous day's high plus 0.1%, so the new batch of orders for Thursday, January 4th, are as follows:


Click on the image to enlarge.

As you can see, these are set to trigger at 9:40 a.m.  The list is different than previous days because the stocks that are in the possible universe versus the ones being held change the composition of the efficient frontier and hence the target optimized portfolio.  For me this is the beauty of this approach -- there is no "perfect" answer and it allows me to adapt to market conditions on the entry and exits.

The new target efficient frontier space is in the following picture.  The present holdings are shown by the yellow diamond and the target portfolio is shown at the intersection of the red line and the blue efficient frontier line:


The way to interpret this is that the present holdings, over the last 100-days or so (due to the EWMA applied to prices), have produced a gain of just over 15% annualized and a volatility of 7.3%.  While underperforming the S&P 500 by a few points the income on the portfolio, if held in 2017, is about $2,600, outperforming a somewhat arbitrary but representative low-risk, higher-income benchmark income portfolio:

In the figure above Portfolio 1 is the Greenfield Optimized Sharpe Ratio portfolio, fully invested, and Portfolio 2 is the comparison income portfolio shown in the next figure, which produced 2.267% income in 2017.


Undoubtedly, someone will ask me as to the current construction of the target portfolio, here it is:


The yellow indicates already purchased positions and the light-green area (or non-yellow) indicates the pending orders for today.

Note that I'm very close at achieving the target numbers:


The target is the "T" and you can see that my present holdings are demonstrating a 15% return/7.3% volatility, for a SR of 1.88 vs. the target of 1.94.  This shows that filling the largest % numbers first gets you quickly to the ballpark of the portfolio, and even with only being 76% invested, the demonstrated performance on the invested portion is rapidly approaching "optimum".

For the entire portfolio to perform as desired I obviously have to get to 100% invested, and today's purchase will get me closer to that mark by another 18% if they all fill.

If they don't all fill, it will be rinse, repeat until they do.

I hope all of this is useful to you to understand what I'm doing, at least at a high level.  I'm excited at the prospect of generating 2.6% income (or more, depending upon 2018 dividend increases), having capital appreciation due to these being quality stocks, and doing it all at a low volatility.

~~~~~~~~~

As with all my ramblings, you are responsible for your own investment decisions and I am not.  Please do your own diligence, and please take ownership for your actions.

Regards,

pgd


Wednesday, January 3, 2018

Optimized Greenfield SR Trades for Jan 3

.
Many of my orders went unfilled with Tuesday's market -- as many of you know, I only buy strength, so many of my entries did not hit their stop market levels.  Here are the trades that filled:


Click on the image to enlarge.

The orders were set to activate after 9:40 a.m.; this allows the overnight book to clear and any opening volatility to be absorbed.  You can see that a few triggered right away, but most did not.

My opening trades for this morning are as follows:

Again, click on the image to enlarge.

The only reason these are GTC is that I cannot enter a day order well after the market close.  If these do not fill today I'll cancel all open orders and re-establish the list for tomorrow.  The mixture and quantity may change tonight, as I run the updates using the most recent closing data.

Even with the limited number of trades filled, the portfolio is 57% complete and is on sound ground with respect to historical return and volatility.  Here is the known efficient frontier of all the stocks that are being held as well as being considered:


The present ownership is the yellow diamond in the middle of the figure and the purple dot, where the blue line intersects the red line, is the target, fully invested portfolio.  Here are the present numbers:


The invested configuration has a historical 14.42% return with a 7.42% volatility level, and the fully-invested target is about the same return with lower volatility, giving a new SR level of 2.03, which is the first time I've ever seen something this high in terms of SR.

I fully expect that SR values right now are artificial, only because the market is on a tear upwards with little to no volatility (the VIX is at 9.61 as I write, which is extremely low).

I note that the average dividend yield of the portfolio is 2.62%, well above the risk-free-rate (RFR) value of 1.26%.  The software does not consider dividend yield in the "Returns" calculation.

There is nothing more to do today except let the orders execute.  I do not expect any of the present holdings to show any signs of a sell signal (to be covered when it occurs) at least until the company reports earnings.  WBS will be first up, as it reports earnings on 1/18 before the market open.

Make it a great day folks.

~~~~~~~~~

As with all my ramblings, you are responsible for your own investment decisions and I am not.  Please do your own diligence, and please take ownership for your actions.

Regards,

pgd


Monday, January 1, 2018

End of 2017, Enter 2018

.
2017 is in the books.  For those of you who were following my work with the Optimized Connor's strategies, here's the bottom line:

Yes, the strategies make money.  This being said, it takes a considerable amount of work to do so, and this work is on a daily basis.  Take a day off and you potentially miss a trade, lowering the overall gains.

My actual returns for the period tested (through September 2017) were slightly more than 6% net gain (inclusive of fees, transaction costs, missed trades, etc.).  Had I used a bigger account (greater than $100K), I may have been able to achieve 7% for the account.  These are not annualized numbers -- these are raw gains for the period January 2017 through September 2017.

I note that there was never a major event that took the markets south, and in a mean-reversion strategy (such as all of Connor's strategies), if you are in a trade and expecting recovery when the market really turns you can get hammered (recall that stop losses significantly reduce gross gains in every tested Connors portfolio). 

As a comparison, my wife's TSP account (roughly equivalent to the ETFs EFA, SPY, VXF, AGG) is running about 18% over the past 12 months.  Management there is no more than 2x per month, and it's simply a matter of looking at the past 1-month performance of the EFA, SPY, VXF, and AGG and making a simple adjustment.  It takes me about 10 minutes tops, per month.  Of course this is an exceptional year and her account normally is in the 6% annual range, so I have no expectation that these high numbers will continue.  Nevertheless, management of my wife's account has been brainless, at least compared to the Connor's strategies.

All of this being said, I wholeheartedly support others who believe in the Connor's strategies, but suffice to say, I believe that there are better ways to trade (let alone invest) that can better utilize my time and effort.

~~~~~~~~~~~~~

Optimized Greenfield Sharp Ratio Portfolio

Since September I've been working on the development and testing of a lower-activity/interaction portfolio.  I simply do not have the time to run Connor's scans, enter trades, watch them day over day, and rinse/repeat.  I travel often, and the different time zones kill my ability to manage my accounts on a daily basis.

Yes, exposure (risk) goes up when you are fully invested.  I acknowledge this.  Volatility is a manifestation of visible risk so optimizing on risk (volatility) is one way not have a high ulcer index.

Here are the basic tenants of this Optimized Greenfield Sharp Ratio Portfolio, and all must be true at the time of purchase:

  1. positive year-over-year (YoY) increase in revenues
  2. positive quarter-over-1-year-ago-quarter (QoQ) increase in revenues
  3. positive trailing-twelve-months (TTM) growth in revenues
  4. positive revenues for the current quarter
  5. positive year-over-year (YoY) increase in EPS
  6. positive quarter-over-1-year-ago-quarter (QoQ) increase in EPS
  7. positive trailing-twelve-months (TTM) growth in EPS
  8. positive EPS for the current quarter
For those of you who have been following me for years, you should recognize this criteria as the basis of the Greenfield screen.  This criteria will (generally) keep you out of hot water, as it rejects companies who have falling revenues and are buying back their shares to increase EPS.  Rising revenues AND EPS, when brought together, cut the universe of quality companies down to about 300-400 in any one screen.

But wait!  There's more.  A few technical requirements must exist:
  1. The close is above the 50d MA (price)
  2. The 50d MA is above the 150d MA
  3. The 150d MA is above the 200d MA
  4. The 200d MA has a positive slope upward for at least the past 10 consecutive trading days
  5. The average volume of the stock must be at least 150,000 shares on a 10-day average and 3-month average basis
Again, the above is taken as a refinement of my Greenfield screen.  These technicals, in combination with the revenue and EPS criteria, further reduce the scan list to 100-150 stocks at any given time.  This is quite manageable.

~~~~~~~~~~


I have software that allows you to calculate the optimum portfolio with respect to Sharpe Ratio (SR).   The software takes a list of stocks, an expected market performance (I use 12% annualized), looks at the risk-free-rate (RFR) of the market, which is about 1.26% annualized as I write this (use the 1-month treasury), and then it looks at the exponentially weighted moving average (EWMA) of closing prices over the last year or so for each stock.  Since the EWMA weights the more recent prices and price differentials (volatility) higher, recent activity at the time of calculation (and potential purchase) plays a significant role.  When you take the past performance and divide it by the standard deviation of the volatility you end up with the SR of the stock.

The software looks at all the different combinations of stocks that you are considering and develops a "space" that defines what is called the "efficient frontier".  Here's an example of an efficient frontier for a set of stocks that I am current considering:


The plot shows volatility on the x-axis and historical (~100 day) return on the y-axis.  You can see that SQM has both a high return as well as a high volatility, so it's located way in the upper right corner.  HON has the lowest volatility of the lot, and is at the midpoint of the scale in return, so is located on the y-axis right around the 12.11% mark.

The blue line defines the efficient frontier -- there is a combination of stocks and weights to those stocks that will place you on that blue line.

The red line is defined by the current RFR, and where it intersects the blue line is the historical return and volatility for the optimized portfolio.

Determining the exact portfolio with the software is done with a push of a button -- the math is quite complicated and while I understand it for two stocks, understanding it for 10, 20, 100+ is beyond me.  That's why I bought the software  :)

If you are not familiar with Sharp Ratio then I urge you to click here.

If you are presently invested (I am), the software tells me what the existing numbers are for my existing portfolio and the new portfolio numbers.  The output looks like this:


I didn't include the column headers -- "R" means return and "V" means volatility.

My present ownership of stocks is running about a historical annualized return of 16.87% and a standard deviation of volatility of 14.59%.  Divide the two and you get the SR = 1.07.

The software is suggesting a slightly modified change to the portfolio that takes me to the numbers shown in the upper part of the table.  The shift from an old SR of 1.07 to a new value of 1.338 is significant and I've already placed my orders for Tuesday.

Note that I've constrained the software to not recommend any SELLING, only adding more stocks to improve the SR.  Selling is a different topic and I'll cover that in another blog entry.  It's easy, but it may not be wife-TSP-account easy (see my opening above).

~~~~~~~~~~~~

Unfortunately, I didn't start developing this Optimized Greenfield Sharpe Ratio Portfolio approach until September 2017, so data is early.  This being said, I'm going to run a real portfolio with it, with actual money management, so we'll see how it does.

Another caveat:  I'm only going to invest into dividend stocks, and those that are higher than the mean yield reported by the scan.  For example, the current mean yield of all the dividend stocks meeting my Greenfield criteria is 1.67%.  If you are curious as to what stocks and ETFs are returned, here's the list (I will NOT be posting this often but you can see the quality of the stocks returned by the scan from this list):

BBL
BHP
CLX
CM
DEO
DNKN
DRI
EMR
EV
EVR
FHN
HASI
HD
HI
HLI
HLS
HON
ITW
JPM
KAR
LM
MANT
MC
MGA
MNR
MS
MSFT
PAYX
PBF
PETS
PFG
PKG
ROK
SCHN
SQM
STT
TD
TEO
TROW
TRST
TXN
UNM
VALE
WBS
WM
WRK
WYN
XLK

So, if I am going to build a NEW portfolio, to start on January 2nd, the software gives me the following as the optimum portfolio and weights:

XLK 36.66%
JPM 8.29%
HON 6.21%
WRK 4.35%
PAYX 4.28%
CLX 3.88%
HD 3.78%
WYN 2.89%
HLS 2.88%
MGA 2.61%
KAR 2.33%
EMR 2.33%
BHP 2.31%
WBS 2.30%
HASI 2.25%
MSFT 2.18%
CM 2.03%
MNR 1.49%
DRI 1.25%
DNKN 1.16%
LM 1.13%
PFG 0.90%
HLI 0.85%
MS 0.78%
ROK 0.55%
STT 0.36%
If I buy each one of these positions with the weights shown, I should be in the ballpark of the following historical performance (past performance is no guarantee of future returns):


"Current Portfolio" is ##### because I don't own anything in this ideal portfolio.  Note that the NEW portfolio structure does not perform as well as my present holdings -- this is simply because I have ownership of stocks that are not in the current solution set as of the run of December 29th.  

The key takeaway here is that 14% gains at a volatility of 7.69% has been achieved with this portfolio, for a massively improved SR compared to what I'm holding right now, so this is a good portfolio.

Of course, I could feed just bonds or bond funds to the software and it would give me great SRs but poor returns -- far under 12% target -- so the input to the system matters.

~~~~~~~~~~~~

Stay tuned.  We should learn something in 2018 about this portfolio.  It will also provide dividend income too, which is important for many.

~~~~~~

As with all my ramblings, you are responsible for your own investment decisions and I am not.  Please do your own diligence, and please take ownership for your actions.

Regards,

pgd