If you are on the blog page in a web browser from a computer, please subscribe to this using the "Follow by Email" link to the left. If you're on a mobile device you should see something in the frame that allows you to subscribe. Having your email helps me to notify you when Google mucks up email distribution.
~~~~~~~
I continue to work on filling the portfolio with trades. 76% of the portfolio is obligated, with the following positions and sizing presently being held:

Click on the image to enlarge.
A number of orders did not fill because they did not take out the previous day's high plus 0.1%, so the new batch of orders for Thursday, January 4th, are as follows:

Click on the image to enlarge.
The new target efficient frontier space is in the following picture. The present holdings are shown by the yellow diamond and the target portfolio is shown at the intersection of the red line and the blue efficient frontier line:

The way to interpret this is that the present holdings, over the last 100-days or so (due to the EWMA applied to prices), have produced a gain of just over 15% annualized and a volatility of 7.3%. While underperforming the S&P 500 by a few points the income on the portfolio, if held in 2017, is about $2,600, outperforming a somewhat arbitrary but representative low-risk, higher-income benchmark income portfolio:

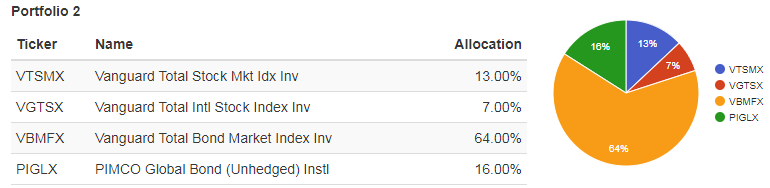
Undoubtedly, someone will ask me as to the current construction of the target portfolio, here it is:

The yellow indicates already purchased positions and the light-green area (or non-yellow) indicates the pending orders for today.
Note that I'm very close at achieving the target numbers:

The target is the "T" and you can see that my present holdings are demonstrating a 15% return/7.3% volatility, for a SR of 1.88 vs. the target of 1.94. This shows that filling the largest % numbers first gets you quickly to the ballpark of the portfolio, and even with only being 76% invested, the demonstrated performance on the invested portion is rapidly approaching "optimum".
For the entire portfolio to perform as desired I obviously have to get to 100% invested, and today's purchase will get me closer to that mark by another 18% if they all fill.
If they don't all fill, it will be rinse, repeat until they do.
I hope all of this is useful to you to understand what I'm doing, at least at a high level. I'm excited at the prospect of generating 2.6% income (or more, depending upon 2018 dividend increases), having capital appreciation due to these being quality stocks, and doing it all at a low volatility.
~~~~~~~~~
As with all my ramblings, you are responsible for your own investment decisions and I am not. Please do your own diligence, and please take ownership for your actions.
Regards,
pgd
No comments:
Post a Comment