If you are on the blog page in a web browser from a computer, please subscribe to this using the "Follow by Email" link to the left. If you're on a mobile device you should see something in the frame that allows you to subscribe. Having your email helps me to notify you when Google mucks up email distribution.
~~~~~~~~~~
The Fisher Transform
Yesterday I published preliminary results regarding the Fisher Transform, specifically findings around when to buy and sell. If you did not read that entry here is the link: https://fwdtest.blogspot.com/2018/10/preliminary-results-fisher-transform.html
The tests provided yesterday were performed using the SP 500 basket of stocks across multiple time frames, specifically 2004-2014, 2006-2016, and 2008-2018. I chose that basket because the number of stocks across the different periods is relatively constant; 2014 used 486 stocks while 2018 used 500. While there may be some survivorship bias in the results it is a small portion of the total, so I'm not overly concerned. Whether the stocks that were in the index in 2018 were in the index in 2014 is irrelevant -- I simply am trying to obtain behavior on a basket of stocks, and the SP 500 is a big basket to run tests against.
I also initially test these baskets in a way that keeps some capital in the account so that the account never runs out of cash. This is because running out of capital (during testing) becomes a constraint on the system, and it limits the performance (or improves it, as we will see). In either case, if we are trying to understand group behavior (e.g. how does an entry/exit signal perform using a "random" basket of stocks), then limiting that basket will also skew results.
The following figure shows the impact of undersizing each position in a basket of stocks:

As you can see in the figure above, which is a 10-year span, the test never deploys 100% of the cash -- if a stock is available to participate then it does.
Contrasting, here is what happens when you only allow 4 stocks to be part of your portfolio:

Position Sizing with the Fisher Transform (and in General)
Position sizing is a significant concept to grasp, because it ultimately impacts your returns. If you have too many positions (over diversified), not only is this difficult to manage, but you literally are missing out on gains available in individual positions because your position size, relative to the portfolio, is too small. Think mutual fund or ETF and you understand the concept.
Historically, the ballpark number is between 7 and 25, but the actual number depends largely on stock selection and entry/exit criteria. Poor exit criteria and you ride your stocks down but if you have many this may not be bad -- but if you have few it is disasterous. Seems obvious but it is not a "one size fits all" answer.
VectorVest generally goes with 10. This is safe but certainly not always the best.
GorillaTrades varies with an entry or two per night, and by the time you sell your initial profit target, you could be holding 25-50 small positions and this will absolutely drive you batty crazy.
Hence, the key is to find a sweet-spot in position sizing that maximizes return but minimizes drawdown (risk).
To demonstrate the procedure, the test is going to vary the position size between 1% (100 positions if all were invested) and 25% (4 positions if fully invested). Two primary variables are to be observed:
- Total Return (TR)
- Maximum Drawdown
A third variable will be optimized: the quotient of these two (TR/MDD). This is because we want to balance reward (TR) with risk (MDD).
Here are the results:
First, Total Return (TR):
First, Total Return (TR):

Click on the image to enlarge,
Note that between 2% and 16% (50 and 6 positions) that the total return has a tight grouping and increases as the number of positions drops (or as the position size grows). This is what we expect -- if we have too many positions (small position size), we are overdiversified and for a large number of trades, we dilute our portfolio too much.
Also note that after 16% the variance of returns gets quite large. This is due to the "running out of cash" constraint and means that whatever stock was available when cash became available was the next candidate. This is a dangerous place to think you can ever duplicate the TR values, as total return in this area is completely dependent upon market conditions and whatever stock is available.
Based on the results above I would have absolutely no fewer than 6 positions and no more than 50 positions (50 is too much, but the data is what it is).
Let's look at maximum drawdown (MDD):

Click on the image to enlarge.
Here, this shows an opposite behavior to TR: As position size grows, maximum drawdown increases, which is what we expect. The LESS diversified we are the more we are subjected to the individual performance of a stock, and if that stock drops, we capture more of that drop.
Here, this shows an opposite behavior to TR: As position size grows, maximum drawdown increases, which is what we expect. The LESS diversified we are the more we are subjected to the individual performance of a stock, and if that stock drops, we capture more of that drop.
As with the TR plot, we see a much wider variance above 16%, so fewer positions than 6 are not advised. On the maximum number, it goes to reason that if we have 100 positions (1% position size) then we have maximum dilution so the drop in any one position is small, relative to the entire portfolio. Everything checks.
Let's take a look at the ratio between the two, TR / MDD:
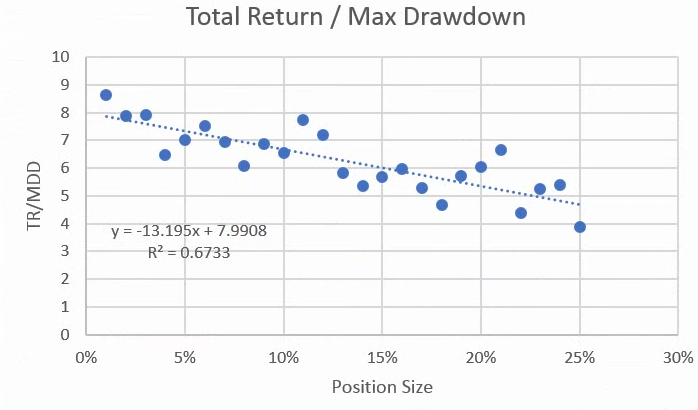
Click on the image to enlarge.
First of all, the downward slope of the curve fit line tells me that MDD has a bigger impact on portfolio performance than does TR. If the line were pointing up we would want to be limiting our positions to a few (perhaps 6-10), but because it is pointing down, this is pushing us to the left, which suggests having more positions in the portfolio.
First of all, the downward slope of the curve fit line tells me that MDD has a bigger impact on portfolio performance than does TR. If the line were pointing up we would want to be limiting our positions to a few (perhaps 6-10), but because it is pointing down, this is pushing us to the left, which suggests having more positions in the portfolio.
The BEST yield of TR/MDD is when there is a position size of 1% -- 100 positions in the portfolio. My experience is that this simply is not practical. Commissions and simple daily management are extremely difficult at this level (think Gorilla Trades).
TR tells us we want to be as far to the right as possible to maximize return. This suggests 16% position size, but it has the worse TR/MDD ratio (as evidenced by the falling trend line).
I would compromise. It appears, if you can stomach the drawdowns, that the position size range of 5%-15% (20 to 7 positions respectively) is not a bad place to be. If you are a bit more conservative the number is closer to 20; if you are a bit more aggressive then you are closer to 7.
I'm going to choose a 9% position size, which will be 11 positions. This will be a good balance going forward.
Note: there is no "correct" answer.
~~~~~~~~~~
Additional work that follows is now to consider putting emergency stops and possible profit targets in place. Note that I'm loathe to put a stop in any strategy, but analysis guides that outcome, not my bias.
~~~~~~~~~
That's all for now. If you have questions -- ask.
~~~~~~~~~
As with all my ramblings, you are responsible for your own actions and I am not. Nothing I've written here is advice to buy or sell any security, so don't do it unless you absolutely take ownership for your actions. Please read and acknowledge the disclaimer on the upper left of the web page where you are reading this.
Regards,
Paul
No comments:
Post a Comment