If you are on the blog page in a web browser from a computer, please subscribe to this using the "Follow by Email" link to the left. Having your email helps me to notify you when Google mucks up email distribution, as they did at the beginning of May.
A couple of readers have indicated they do not see the "Follow by Email" area to enter their email. If you are using a mobile device (iPad, phone, etc.) you may see a button "View web version" under the "Home" button at the bottom of your screen (scroll down). Select "View web version" and you should see the area.
Many thanks to Ron Speiker for checking my work. He found an inconsistency at the beginning of the reporting period (1-year lookback) and because of this I have found some challenges with the TradeStation Portfolio Maestro testing platform in general. These errors do NOT impact current trades -- they only impact historical trades and reporting, It appears that I have fixed the inconsistency as of this morning but will be sending new data to him for independent review. As he (and others) know, this type of verification is quite tedious so again, my heartfelt thanks. This is NOT to say Ron is endorsing this work -- he is simply looking over my shoulder, which I appreciate.
~~~~~~~
Here are the theoretical holdings going into today's open:

Note that there were four positions that were opened yesterday, on 2/8, at the open.
My actual holdings going into the open for today are:
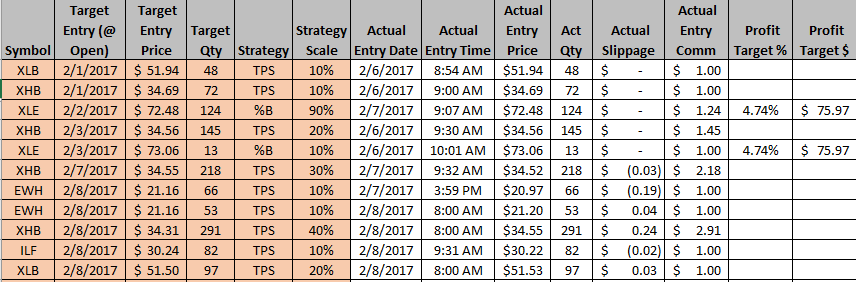
Two positions are signalling a close at the open:
- STC 119 shares EWH @ Open (TPS strategy)
- STC 82 shares ILF @ Open (TPS strategy)
In reality I will make the orders valid after 9;31 AM so not to get the wild swing on the open. History has proven to me that I *never* get the first trade at the open price.
This adjustment will add slippage, which I will track.
~~~~~~~
Historical, rolling, 1-year performance is as follows. The error with TradeStation Portfolio Maestro has been addressed to the best of my knowledge, pending independent review. The numbers will be different than previous blog entries because this is a ROLLING snapshot -- the period shown below is 2/10/2016 to 2/9/2017:
| Summary | Value |
| Total Return | $9,184.96 |
| Total Realized Return | $9,277.79 |
| Gross Profit | $12,311.59 |
| Gross Loss | ($3,033.80) |
| Open Trade P/L | ($92.83) |
| Number of Trades | 174 |
| Number of Winning Trades | 130 |
| Number of Losing Trades | 44 |
| % Profitable | 74.71% |
| Average Trade | $53.32 |
| Average Trade (%) | 0.86% |
| Standard Deviation Trade | $138.65 |
| Standard Deviation Trade (%) | 1.72% |
| Largest Winning Trade | $664.90 |
| Largest Losing Trade | ($561.36) |
| Profit Factor | 4.06 |
| Average Win / Average Loss | 1.37 |
| Sharpe Ratio | 0.2661 |
| K-Ratio | 0.6342 |
| Return Retracement Ratio | 18.9291 |
| Compounded Annual Return | 15.78% |
| Compounded Monthly Return | 1.21% |
| Average Annual Return | $4,592.48 |
| Average Annual Return (%) | 7.74% |
| Average Monthly Return | $706.54 |
| Average Monthly Return (%) | 1.14% |
| Percent Days Profitable | 43.25% |
| Percent Months Profitable | 84.62% |
| Percent Years Profitable | 100.00% |
| Commissions on Futures | $0.00 |
| Commissions on Currencies | $0.00 |
| Commissions on Equities | $786.99 |
| Total Commissions | $786.99 |
Rolling snapshots are far more accurate of an indicator, especially when combined, because they provide a "what if I start right now" view of strategies. This is my intend with posting this on a day-by-day entry.
~~~~~~~~~
As with all my ramblings, you are responsible for your own investment decisions and I am not. Please do your own diligence, and please take ownership for your actions.
Regards,
pgd
No comments:
Post a Comment