If you are on the blog page in a web browser from a computer, please subscribe to this using the "Follow by Email" link to the left. Having your email helps me to notify you when Google mucks up email distribution, as they did at the beginning of May.
~~~~~~~
For the AAII CI-SIG group, we are planning to have a face-face meeting on 3/25. Details to follow.
~~~~~~~
There are two new buy orders for the open on Monday, February 27th:
I am committing $66,603 to these strategies right now.
Buy 10% position in IWM under the TPS-1-2-3-4 strategy:
- TPS allows for 4 positions total. This means that a fully-loaded TPS position would be $16,651.
- 10% of this is $1,665.
- IWM closed Friday at $138.65
- $1,665 / $138.65 = ~ 12 shares.
- The order is BTO (buy to open) 12 shares IWM at market at the open.
Buy 40% position in IWM under the 3d High/Low strategy:
- 3d H/L allows for 4 positions total. The fully-loaded 3d H/L position is the same as TPS at $16,651.
- The optimized initial entry size for 3d H/L is 40%. This is $6,660.
- IWM closed Friday at $138.65
- $6,660 / $138.65 = ~ 48 shares.
- The order is BTO 48 shares IWM at market at the open.
Because of sensitivity to commissions, I will combine these orders as follows:
- BTO 60 shares IWM at market at the open. I will make the order valid at 9:32 a.m. ET, to allow the "book" to clear in the first 2 minutes. This is probably generous.
I am anticipating over 200,000 shares will exchange in the first 2 minutes -- this is a VERY liquid ETF, so delaying the entry by 2 minutes should not present a major price issue with a market order.
The commission difference at TradeStation, for combining these two orders, is relatively insignificant. The total advantage is only [ (separate) - (combined) = ($1 + $1) - ($1) = ] $1 but how many of you still pick up a penny/nickel/quarter when you see it laying on the ground?
~~~~~~~
Weekly Summary
For the week ending 2/24, there were no transactions (Tu-F). Total portfolio gains, including commissions, since 2/3/17 are 0.52%. We have completed 3 weeks so the expectation, given data below, is that we would be at 1.02% cumulative gain. We are underperforming the straight-line benchmark but it has only been 3 weeks, so do not read too much into this.
Monte-Carlo tests (52 weeks (2/25/16 to 2/24/17), 10 samples per run, 1000 runs) shows that average return has moved up slightly from just over 0.31%/week to 0.34%/week:

Click on the image to enlarge.
Monte-Carlo tests of potential weekly drawdown, using the same 52 weeks, shows that there is between a 95% and 99% likelihood that drawdown will be at least 3.0% in any 52-week period.
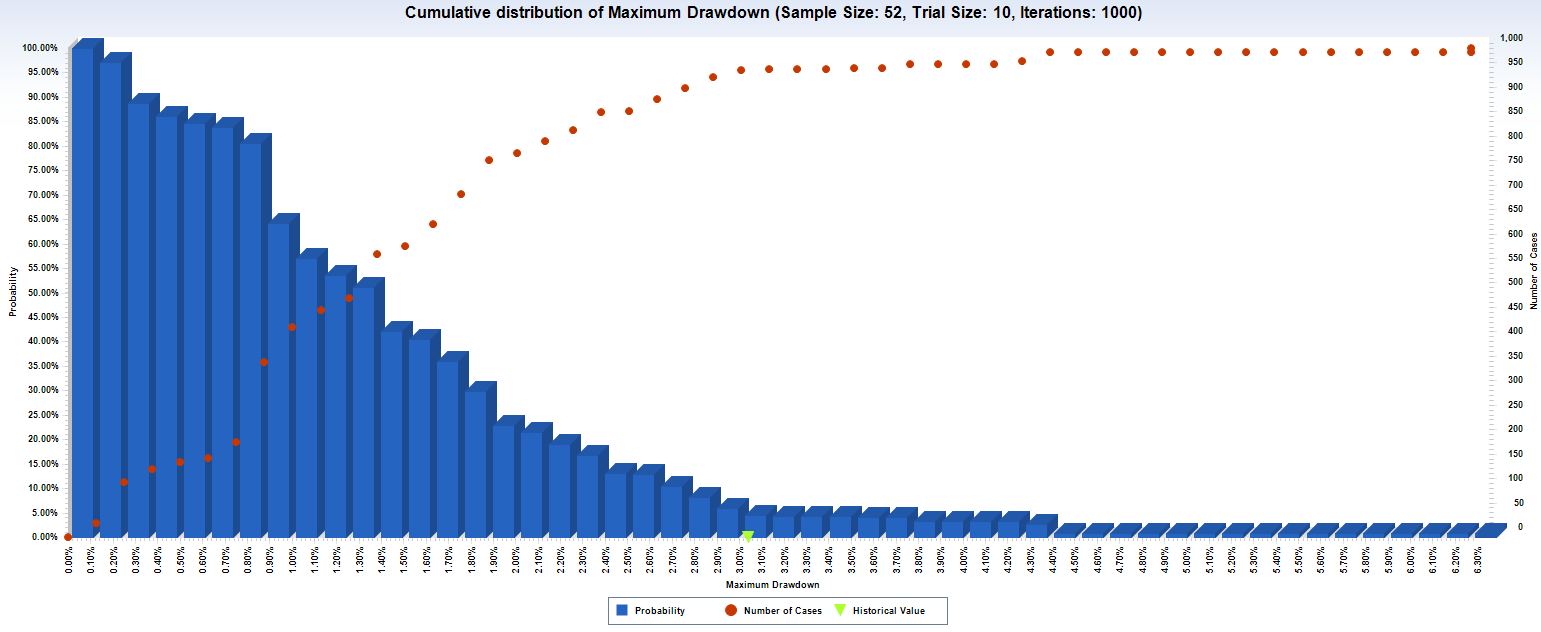
Click on the image to enlarge.
~~~~~~
Consistency of Trades
Last week I introduced a new table to show how the ensemble of strategies performs over a rolling, go-forward day-by-day period. That chart is here. You can also see it in last week's summary blog entry here.
I introduced an additional strategy, the 3d High/Low Strategy during the week. This will change ensemble performance, so the table resets with this new strategy added:

Click on the table to enlarge.
Although profit factor has decreased (3.37 +/- 0.15 vs 4.19 +/- 0.13 last week), the Compounded Annual Return is nearly the same as last week (16.95% +/- 0.90% vs 16.91% +/- 1.00% last week), as is average annual return (8.22% +/- 0.43% vs 8.27% +/- 0.51% last week).
I'm still a bit nervous about the drop in profit factor and the longer-term implications on overall growth in the account, but for now, these two datasets are more/less consistent.
4 observations this past week and 10 the previous two weeks are not great sample sets, so do not read too much into this at this point. It will change this coming week, as I am adding two more long strategies to the available set of tools (Maximum Days Down "MDD" and RSI 10/6 "RSI106"). I intend to wrap up initial testing on these today (Sunday, 2/26).
Capital Deployment
I am still well-under in terms of capital deployment, so there is potentially significant room for improvement. Here is the 1-year lookback on capital deployment; we want 100%, and the fact that we only hit this a few times over the past year shows there is a tremendous amount of idle cash:

Click on the image to enlarge.
All the areas that are NOT at 100% means that capital is sitting on the sideline. I am only deploying 5 strategies right now, out of a minimum of 14, so much work lies ahead.
~~~~~~~
1-Year Rolling Performance
Historical, rolling, 1-year performance is as follows. This is the same information as in the table that is included above, and is provided here for continuity of presentation. The numbers will be different than previous blog entries because this is a ROLLING snapshot -- the period shown below is 2/26/2016 to 2/25/2017 (Saturday morning, to capture all end-of-day trades on the previous day). Note that these are the values that START the next trading day, e.g., 2/27/2017 for the set below:
| Summary | Value |
| Total Return | $10,209.32 |
| Total Realized Return | $10,209.32 |
| Gross Profit | $14,321.03 |
| Gross Loss | ($4,111.71) |
| Open Trade P/L | $0.00 |
| Number of Trades | 188 |
| Number of Winning Trades | 145 |
| Number of Losing Trades | 43 |
| % Profitable | 77.13% |
| Average Trade | $54.30 |
| Average Trade (%) | 0.78% |
| Standard Deviation Trade | $149.66 |
| Standard Deviation Trade (%) | 1.70% |
| Largest Winning Trade | $662.95 |
| Largest Losing Trade | ($706.22) |
| Profit Factor | 3.48 |
| Average Win / Average Loss | 1.03 |
| Sharpe Ratio | 0.2998 |
| K-Ratio | 0.4943 |
| Return Retracement Ratio | 19.7287 |
| Compounded Annual Return | 17.54% |
| Compounded Monthly Return | 1.34% |
| Average Annual Return | $5,104.66 |
| Average Annual Return (%) | 8.50% |
| Average Monthly Return | $785.33 |
| Average Monthly Return (%) | 1.27% |
| Percent Days Profitable | 45.24% |
| Percent Months Profitable | 69.23% |
| Percent Years Profitable | 100.00% |
| Commissions on Futures | $0.00 |
| Commissions on Currencies | $0.00 |
| Commissions on Equities | $848.34 |
| Total Commissions | $848.34 |
Rolling snapshots are far more accurate of an indicator, especially when combined, because they provide a "what if I start right now" view of strategies. This is my intent with posting this on a day-by-day entry.
Go back through older blog entries to review the consistency of the 1-year rolling snapshots.
~~~~~~~~~
As with all my ramblings, you are responsible for your own investment decisions and I am not. Please do your own diligence, and please take ownership for your actions.
Regards,
pgd
~~~~~~~~~
As with all my ramblings, you are responsible for your own investment decisions and I am not. Please do your own diligence, and please take ownership for your actions.
Regards,
pgd
No comments:
Post a Comment