If you are on the blog page in a web browser from a computer, please subscribe to this using the "Follow by Email" link to the left. Having your email helps me to notify you when Google mucks up email distribution, as they did at the beginning of May.
~~~~~~~
Here are the theoretical holdings going into today's open:
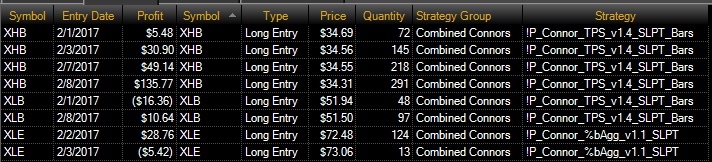
Actual holdings mimic this setup.
~~~~~~
Executed Transactions for 2/9
TPS positions in EWH and ILF were theoretically closed yesterday on 2/9 at the open. I state "theoretically" because I took the trades at the close on 2/8, which provides an ever-so-slight edge compared to next day open. If I cannot be at the machine then the next morning open has been proven to be completely acceptable. Tests with EdgeRater software (www.edgerater.com) have proven this (if you have questions), and I presented this info during our last meeting as well as in one of my newsletters.

Click on the image to enlarge.
EWH was bought in two tranches due to a position size miscalculation on my part (e.g. life intervened) but was sold in one transaction, which is why you see just one commission entry for $1.19 (119 shares total). Each position was independently tracked though, as to make reconciliation easier.
Actual slippage on the close (in green) is the difference of the next-morning-open price vs. the actual price received for the transaction, independent of whether it was closed the night before or at the open.
Total profit for each transaction is shown, net of commissions.
~~~~~~
Pending Transactions for 2/10
There are no purchase transactions.
The fully loaded XHB position should be closed at the open. I took the trade on 2/9 at the close, with the following results:

Click on the image to enlarge.
These are tentative numbers because the Actual Exit Slippage is referred to this morning's open, not last night's close, and I do not yet have that number. Nevertheless, a winning set of trades, net of commissions.
Note that there are two entries for commissions because I had to split the transactions across two separate accounts. I attempt to "fill" one account first, then if there are insufficient monies in one account, I move to the other. Hence there are two entries for $4.35 and $2.91 (435 shares and 291 shares respectively).
~~~~~~
1-Year Rolling Performance
Historical, rolling, 1-year performance is as follows. The numbers will be different than previous blog entries because this is a ROLLING snapshot -- the period shown below is 2/11/2016 to 2/10/2017:
| Summary | Value |
| Total Return | $10,067.46 |
| Total Realized Return | $9,828.55 |
| Gross Profit | $12,758.82 |
| Gross Loss | ($2,930.27) |
| Open Trade P/L | $238.91 |
| Number of Trades | 178 |
| Number of Winning Trades | 133 |
| Number of Losing Trades | 45 |
| % Profitable | 74.72% |
| Average Trade | $55.22 |
| Average Trade (%) | 0.90% |
| Standard Deviation Trade | $138.27 |
| Standard Deviation Trade (%) | 1.66% |
| Largest Winning Trade | $664.90 |
| Largest Losing Trade | ($561.36) |
| Profit Factor | 4.35 |
| Average Win / Average Loss | 1.47 |
| Sharpe Ratio | 0.2975 |
| K-Ratio | 0.6685 |
| Return Retracement Ratio | 21.9635 |
| Compounded Annual Return | 17.29% |
| Compounded Monthly Return | 1.32% |
| Average Annual Return | $5,033.73 |
| Average Annual Return (%) | 8.45% |
| Average Monthly Return | $774.42 |
| Average Monthly Return (%) | 1.24% |
| Percent Days Profitable | 46.03% |
| Percent Months Profitable | 92.31% |
| Percent Years Profitable | 100.00% |
| Commissions on Futures | $0.00 |
| Commissions on Currencies | $0.00 |
| Commissions on Equities | $804.90 |
| Total Commissions | $804.90 |
Rolling snapshots are far more accurate of an indicator, especially when combined, because they provide a "what if I start right now" view of strategies. This is my intend with posting this on a day-by-day entry.
Go back through older blog entries to review the consistency of the 1-year rolling snapshots.
~~~~~~~~~
As with all my ramblings, you are responsible for your own investment decisions and I am not. Please do your own diligence, and please take ownership for your actions.
Regards,
pgd
~~~~~~~~~
As with all my ramblings, you are responsible for your own investment decisions and I am not. Please do your own diligence, and please take ownership for your actions.
Regards,
pgd
No comments:
Post a Comment