If you are on the blog page in a web browser from a computer, please subscribe to this using the "Follow by Email" link to the left. Having your email helps me to notify you when Google mucks up email distribution, as they did at the beginning of May.
~~~~~~~
Here are the theoretical holdings going into Monday's open:
My actual holdings are with XLE, as I redeemed XLB at the close on 2/10.
~~~~~~
Executed Transactions for 2/10
XHB signaled a close @ the open on 2/10, and this published price was $34.79. Actual results vary, with an actual capture price of 34.80, or a 1-penny-per-share advantage. Do this for 100 years and it will add up <grin>.
Pending Transactions for 2/13
There are no purchase transactions.
The following order should be placed for the open on 2/13, if it has not already been taken:
- STC 145 shares XLB @ market
I took the trade at the close on 2/10, since I was sitting in front of my machine, and my fill price was $52.11 on a closing price of $52.10 (1-penny-per-share advantage there too).
~~~~~~
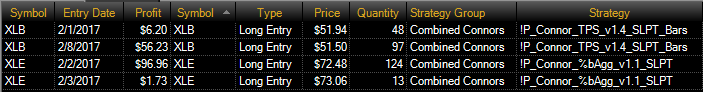
Weekly Summary
For the week ending 2/10, here are the transactions:

Click on the image to enlarge.
Total captured profits are $258.64, net of commissions.
$47,517.56 was committed, including commissions
$37,836.66 was returned, including commissions
(A committed $9,939.54 is still outstanding in XLE)
Total gain for the week, net of commissions, was 0.68%.
A Monte Carlo run shows that we are ahead of schedule, but of course, 1-week is just 1 week. Nevertheless, it's a start:
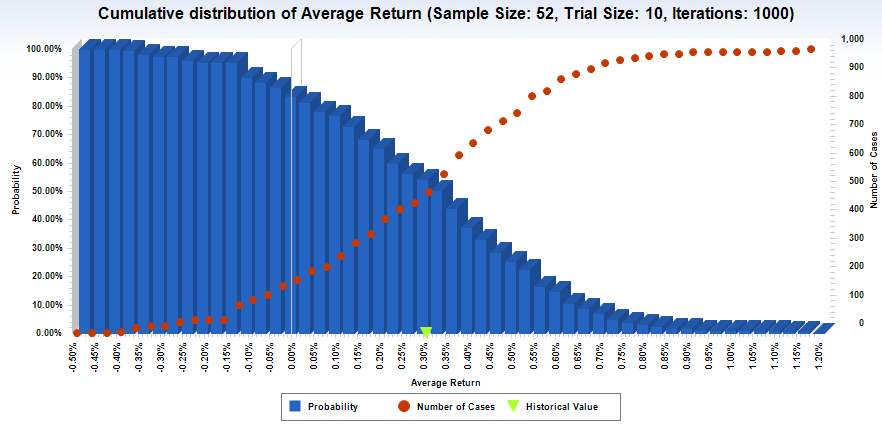
Click on the image to enlarge.
The Monte Carlo results above show an average return of just over 0.3% per week, with an arbitrary 10 weeks used in the sample set, and 1000 iterations run, picking any sample out of the 52 weeks available.
~~~~~~
1-Year Rolling Performance
Historical, rolling, 1-year performance is as follows. The numbers will be different than previous blog entries because this is a ROLLING snapshot -- the period shown below is 2/12/2016 to 2/11/2017:
| Summary | Value |
| Total Return | $9,705.68 |
| Total Realized Return | $9,544.56 |
| Gross Profit | $12,462.19 |
| Gross Loss | ($2,917.63) |
| Open Trade P/L | $161.12 |
| Number of Trades | 177 |
| Number of Winning Trades | 133 |
| Number of Losing Trades | 44 |
| % Profitable | 75.14% |
| Average Trade | $53.92 |
| Average Trade (%) | 0.87% |
| Standard Deviation Trade | $137.03 |
| Standard Deviation Trade (%) | 1.63% |
| Largest Winning Trade | $664.90 |
| Largest Losing Trade | ($561.36) |
| Profit Factor | 4.27 |
| Average Win / Average Loss | 1.41 |
| Sharpe Ratio | 0.2847 |
| K-Ratio | 0.6635 |
| Return Retracement Ratio | 20.9144 |
| Compounded Annual Return | 16.67% |
| Compounded Monthly Return | 1.28% |
| Average Annual Return | $4,852.84 |
| Average Annual Return (%) | 8.14% |
| Average Monthly Return | $746.59 |
| Average Monthly Return (%) | 1.20% |
| Percent Days Profitable | 44.05% |
| Percent Months Profitable | 84.62% |
| Percent Years Profitable | 100.00% |
| Commissions on Futures | $0.00 |
| Commissions on Currencies | $0.00 |
| Commissions on Equities | $795.06 |
| Total Commissions | $795.06 |
Rolling snapshots are far more accurate of an indicator, especially when combined, because they provide a "what if I start right now" view of strategies. This is my intend with posting this on a day-by-day entry.
Go back through older blog entries to review the consistency of the 1-year rolling snapshots.
~~~~~~~~~
As with all my ramblings, you are responsible for your own investment decisions and I am not. Please do your own diligence, and please take ownership for your actions.
Regards,
pgd
~~~~~~~~~
As with all my ramblings, you are responsible for your own investment decisions and I am not. Please do your own diligence, and please take ownership for your actions.
Regards,
pgd
No comments:
Post a Comment