Friday, February 17, 2017

Trades into Friday, February 17th

.
If you are on the blog page in a web browser from a computer, please subscribe to this using the "Follow by Email" link to the left.  Having your email helps me to notify you when Google mucks up email distribution, as they did at the beginning of May.

~~~~~~~

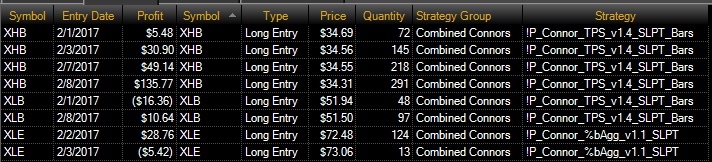
There are no open positions going into the open for Friday, February 17th.

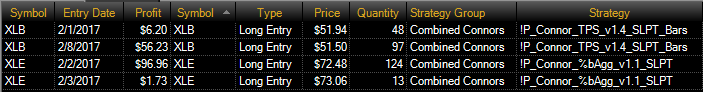
There are no pending purchase orders going into the open for Friday, February 17th.

~~~~~~~

1-Year Rolling Performance

Historical, rolling, 1-year performance is as follows.  The numbers will be different than previous blog entries because this is a ROLLING snapshot -- the period shown below is 2/18/2016 to 2/17/2017:

Summary Value
Total Return $9,478.40
Total Realized Return $9,478.40
Gross Profit $12,372.14
Gross Loss ($2,893.74)
Open Trade P/L $0.00
   
Number of Trades 178
Number of Winning Trades 134
Number of Losing Trades 44
% Profitable 75.28%
   
Average Trade $53.25
Average Trade (%) 0.85%
Standard Deviation Trade $135.41
Standard Deviation Trade (%) 1.61%
Largest Winning Trade $664.90
Largest Losing Trade ($561.36)
   
Profit Factor 4.28
Average Win / Average Loss 1.4
Sharpe Ratio 0.279
K-Ratio 0.5855
Return Retracement Ratio 20.1259
   
Compounded Annual Return 16.28%
Compounded Monthly Return 1.25%
   
Average Annual Return $4,739.20
Average Annual Return (%) 7.94%
Average Monthly Return $729.11
Average Monthly Return (%) 1.18%
   
Percent Days Profitable 43.87%
Percent Months Profitable 76.92%
Percent Years Profitable 100.00%
   
Commissions on Futures $0.00
Commissions on Currencies $0.00
Commissions on Equities $773.00
Total Commissions $773.00

Rolling snapshots are far more accurate of an indicator, especially when combined, because they provide a "what if I start right now" view of strategies.   This is my intend with posting this on a day-by-day entry.

Go back through older blog entries to review the consistency of the 1-year rolling snapshots.  

~~~~~~~~~

As with all my ramblings, you are responsible for your own investment decisions and I am not.  Please do your own diligence, and please take ownership for your actions.

Regards,

pgd

Thursday, February 16, 2017

Trades into Thursday, February 16th

.
If you are on the blog page in a web browser from a computer, please subscribe to this using the "Follow by Email" link to the left.  Having your email helps me to notify you when Google mucks up email distribution, as they did at the beginning of May.

~~~~~~~

There are no open positions going into the open for Thursday, February 16th.

There are no pending purchase orders going into the open for Thursday, February 16th.

~~~~~~~

1-Year Rolling Performance

Historical, rolling, 1-year performance is as follows.  The numbers will be different than previous blog entries because this is a ROLLING snapshot -- the period shown below is 2/17/2016 to 2/16/2017:

Summary Value
Total Return $9,555.36
Total Realized Return $9,555.36
Gross Profit $12,449.10
Gross Loss ($2,893.74)
Open Trade P/L $0.00
   
Number of Trades 179
Number of Winning Trades 135
Number of Losing Trades 44
% Profitable 75.42%
   
Average Trade $53.38
Average Trade (%) 0.86%
Standard Deviation Trade $135.04
Standard Deviation Trade (%) 1.62%
Largest Winning Trade $664.90
Largest Losing Trade ($561.36)
   
Profit Factor 4.3
Average Win / Average Loss 1.4
Sharpe Ratio 0.2819
K-Ratio 0.581
Return Retracement Ratio 20.3135
   
Compounded Annual Return 16.41%
Compounded Monthly Return 1.26%
   
Average Annual Return $4,777.68
Average Annual Return (%) 8.01%
Average Monthly Return $735.03
Average Monthly Return (%) 1.18%
   
Percent Days Profitable 44.27%
Percent Months Profitable 76.92%
Percent Years Profitable 100.00%
   
Commissions on Futures $0.00
Commissions on Currencies $0.00
Commissions on Equities $775.42
Total Commissions $775.42


Rolling snapshots are far more accurate of an indicator, especially when combined, because they provide a "what if I start right now" view of strategies.   This is my intend with posting this on a day-by-day entry.

Go back through older blog entries to review the consistency of the 1-year rolling snapshots.  

~~~~~~~~~

As with all my ramblings, you are responsible for your own investment decisions and I am not.  Please do your own diligence, and please take ownership for your actions.

Regards,

pgd

Wednesday, February 15, 2017

Trades into Wednesday, February 15th

.
If you are on the blog page in a web browser from a computer, please subscribe to this using the "Follow by Email" link to the left.  Having your email helps me to notify you when Google mucks up email distribution, as they did at the beginning of May.

~~~~~~~

Here are the theoretical holdings going into Wednesday's open:


~~~~~~~

Pending Transactions for 2/15

The following order should be placed for the open:
  • STC 137 XLE @ Open
Since I was home Tuesday and able to be in front of my computer at 4 pm ET, I took the trade then.


Click on the image to enlarge.

Actual slippage, relative to this morning's open, will be completed later.  

With this XLE transaction, there are no further holdings -- I am 100% in cash.

There are no pending purchase instructions.


~~~~~~~

1-Year Rolling Performance

Historical, rolling, 1-year performance is as follows.  The numbers will be different than previous blog entries because this is a ROLLING snapshot -- the period shown below is 2/16/2016 to 2/15/2017:


Summary Value
Total Return $9,582.34
Total Realized Return $9,431.59
Gross Profit $12,485.99
Gross Loss ($3,054.40)
Open Trade P/L $150.75
Number of Trades 179
Number of Winning Trades 133
Number of Losing Trades 46
% Profitable 74.30%
Average Trade $52.69
Average Trade (%) 0.83%
Standard Deviation Trade $137.12
Standard Deviation Trade (%) 1.68%
Largest Winning Trade $664.90
Largest Losing Trade ($561.36)
Profit Factor 4.09
Average Win / Average Loss 1.41
Sharpe Ratio 0.2807
K-Ratio 0.5788
Return Retracement Ratio 20.1532
Compounded Annual Return 16.46%
Compounded Monthly Return 1.26%
Average Annual Return $4,791.17
Average Annual Return (%) 8.03%
Average Monthly Return $737.10
Average Monthly Return (%) 1.19%
Percent Days Profitable 43.87%
Percent Months Profitable 84.62%
Percent Years Profitable 100.00%
Commissions on Futures $0.00
Commissions on Currencies $0.00
Commissions on Equities $797.75
Total Commissions $797.75


Rolling snapshots are far more accurate of an indicator, especially when combined, because they provide a "what if I start right now" view of strategies.   This is my intend with posting this on a day-by-day entry.

Go back through older blog entries to review the consistency of the 1-year rolling snapshots.  

~~~~~~~~~

As with all my ramblings, you are responsible for your own investment decisions and I am not.  Please do your own diligence, and please take ownership for your actions.

Regards,

pgd

Tuesday, February 14, 2017

Trades into Tuesday, February 14

.
If you are on the blog page in a web browser from a computer, please subscribe to this using the "Follow by Email" link to the left.  Having your email helps me to notify you when Google mucks up email distribution, as they did at the beginning of May.

~~~~~~~

Here are the theoretical holdings going into Tuesday's open:


My actual holdings mirror this position.

~~~~~~~

Pending Transactions for 2/14

There are no pending transactions for today.

~~~~~~~

1-Year Rolling Performance

Historical, rolling, 1-year performance is as follows.  The numbers will be different than previous blog entries because this is a ROLLING snapshot -- the period shown below is 2/15/2016 to 2/14/2017:


Summary Value
Total Return $9,549.46
Total Realized Return $9,431.59
Gross Profit $12,485.99
Gross Loss ($3,054.40)
Open Trade P/L $117.87
   
Number of Trades 179
Number of Winning Trades 133
Number of Losing Trades 46
% Profitable 74.30%
   
Average Trade $52.69
Average Trade (%) 0.83%
Standard Deviation Trade $137.12
Standard Deviation Trade (%) 1.68%
Largest Winning Trade $664.90
Largest Losing Trade ($561.36)
   
Profit Factor 4.09
Average Win / Average Loss 1.41
Sharpe Ratio 0.2805
K-Ratio 0.5786
Return Retracement Ratio 20.0841
   
Compounded Annual Return 16.45%
Compounded Monthly Return 1.26%
   
Average Annual Return $4,774.73
Average Annual Return (%) 8.00%
Average Monthly Return $734.57
Average Monthly Return (%) 1.18%
   
Percent Days Profitable 43.65%
Percent Months Profitable 84.62%
Percent Years Profitable 100.00%
   
Commissions on Futures $0.00
Commissions on Currencies $0.00
Commissions on Equities $797.75
Total Commissions $797.75
Rolling snapshots are far more accurate of an indicator, especially when combined, because they provide a "what if I start right now" view of strategies.   This is my intend with posting this on a day-by-day entry.

Go back through older blog entries to review the consistency of the 1-year rolling snapshots.  

~~~~~~~~~

As with all my ramblings, you are responsible for your own investment decisions and I am not.  Please do your own diligence, and please take ownership for your actions.

Regards,

pgd

Saturday, February 11, 2017

Trades into Monday, February 13th

.
If you are on the blog page in a web browser from a computer, please subscribe to this using the "Follow by Email" link to the left.  Having your email helps me to notify you when Google mucks up email distribution, as they did at the beginning of May.

~~~~~~~

Here are the theoretical holdings going into Monday's open:


My actual holdings are with XLE, as I redeemed XLB at the close on 2/10.

~~~~~~

Executed Transactions for 2/10

XHB signaled a close @ the open on 2/10, and this published price was $34.79.  Actual results vary, with an actual capture price of 34.80, or a 1-penny-per-share advantage.  Do this for 100 years and it will add up <grin>.

Pending Transactions for 2/13

There are no purchase transactions.

The following order should be placed for the open on 2/13, if it has not already been taken:
  • STC 145 shares XLB @ market
I took the trade at the close on 2/10, since I was sitting in front of my machine, and my fill price was $52.11 on a closing price of $52.10 (1-penny-per-share advantage there too).

~~~~~~

Weekly Summary

For the week ending 2/10, here are the transactions:

Click on the image to enlarge.

Total captured profits are $258.64, net of commissions.
$47,517.56 was committed, including commissions
$37,836.66 was returned, including commissions
(A committed $9,939.54 is still outstanding in XLE)
Total gain for the week, net of commissions, was 0.68%.

A Monte Carlo run shows that we are ahead of schedule, but of course, 1-week is just 1 week.  Nevertheless, it's a start:

Click on the image to enlarge.

The Monte Carlo results above show an average return of just over 0.3% per week, with an arbitrary 10 weeks used in the sample set, and 1000 iterations run, picking any sample out of the 52 weeks available.

~~~~~~

1-Year Rolling Performance

Historical, rolling, 1-year performance is as follows.  The numbers will be different than previous blog entries because this is a ROLLING snapshot -- the period shown below is 2/12/2016 to 2/11/2017:

Summary Value
Total Return $9,705.68
Total Realized Return $9,544.56
Gross Profit $12,462.19
Gross Loss ($2,917.63)
Open Trade P/L $161.12
Number of Trades 177
Number of Winning Trades 133
Number of Losing Trades 44
% Profitable 75.14%
Average Trade $53.92
Average Trade (%) 0.87%
Standard Deviation Trade $137.03
Standard Deviation Trade (%) 1.63%
Largest Winning Trade $664.90
Largest Losing Trade ($561.36)
Profit Factor 4.27
Average Win / Average Loss 1.41
Sharpe Ratio 0.2847
K-Ratio 0.6635
Return Retracement Ratio 20.9144
Compounded Annual Return 16.67%
Compounded Monthly Return 1.28%
Average Annual Return $4,852.84
Average Annual Return (%) 8.14%
Average Monthly Return $746.59
Average Monthly Return (%) 1.20%
Percent Days Profitable 44.05%
Percent Months Profitable 84.62%
Percent Years Profitable 100.00%
Commissions on Futures $0.00
Commissions on Currencies $0.00
Commissions on Equities $795.06
Total Commissions $795.06
Rolling snapshots are far more accurate of an indicator, especially when combined, because they provide a "what if I start right now" view of strategies.   This is my intend with posting this on a day-by-day entry.

Go back through older blog entries to review the consistency of the 1-year rolling snapshots.  

~~~~~~~~~

As with all my ramblings, you are responsible for your own investment decisions and I am not.  Please do your own diligence, and please take ownership for your actions.

Regards,

pgd

Friday, February 10, 2017

Trades into Friday, February 10th

.
If you are on the blog page in a web browser from a computer, please subscribe to this using the "Follow by Email" link to the left.  Having your email helps me to notify you when Google mucks up email distribution, as they did at the beginning of May.

~~~~~~~

Here are the theoretical holdings going into today's open:


Actual holdings mimic this setup.

~~~~~~
Executed Transactions for 2/9

TPS positions in EWH and ILF were theoretically closed yesterday on 2/9 at the open.  I state "theoretically" because I took the trades at the close on 2/8, which provides an ever-so-slight edge compared to next day open.  If I cannot be at the machine then the next morning open has been proven to be completely acceptable.  Tests with EdgeRater software (www.edgerater.com) have proven this (if you have questions), and I presented this info during our last meeting as well as in one of my newsletters.

Click on the image to enlarge.

EWH was bought in two tranches due to a position size miscalculation on my part (e.g. life intervened) but was sold in one transaction, which is why you see just one commission entry for $1.19 (119 shares total).  Each position was independently tracked though, as to make reconciliation easier.

Actual slippage on the close (in green) is the difference of the next-morning-open price vs. the actual price received for the transaction, independent of whether it was closed the night before or at the open.

Total profit for each transaction is shown, net of commissions.

~~~~~~

Pending Transactions for 2/10

There are no purchase transactions.

The fully loaded XHB position should be closed at the open.  I took the trade on 2/9 at the close, with the following results:

Click on the image to enlarge.

These are tentative numbers because the Actual Exit Slippage is referred to this morning's open, not last night's close, and I do not yet have that number.   Nevertheless, a winning set of trades, net of commissions.

Note that there are two entries for commissions because I had to split the transactions across two separate accounts.  I attempt to "fill" one account first, then if there are insufficient monies in one account, I move to the other.  Hence there are two entries for $4.35 and $2.91 (435 shares and 291 shares respectively).

~~~~~~

1-Year Rolling Performance

Historical, rolling, 1-year performance is as follows.  The numbers will be different than previous blog entries because this is a ROLLING snapshot -- the period shown below is 2/11/2016 to 2/10/2017:

Summary Value
Total Return $10,067.46
Total Realized Return $9,828.55
Gross Profit $12,758.82
Gross Loss ($2,930.27)
Open Trade P/L $238.91
   
Number of Trades 178
Number of Winning Trades 133
Number of Losing Trades 45
% Profitable 74.72%
   
Average Trade $55.22
Average Trade (%) 0.90%
Standard Deviation Trade $138.27
Standard Deviation Trade (%) 1.66%
Largest Winning Trade $664.90
Largest Losing Trade ($561.36)
   
Profit Factor 4.35
Average Win / Average Loss 1.47
Sharpe Ratio 0.2975
K-Ratio 0.6685
Return Retracement Ratio 21.9635
   
Compounded Annual Return 17.29%
Compounded Monthly Return 1.32%
   
Average Annual Return $5,033.73
Average Annual Return (%) 8.45%
Average Monthly Return $774.42
Average Monthly Return (%) 1.24%
   
Percent Days Profitable 46.03%
Percent Months Profitable 92.31%
Percent Years Profitable 100.00%
   
Commissions on Futures $0.00
Commissions on Currencies $0.00
Commissions on Equities $804.90
Total Commissions $804.90

Rolling snapshots are far more accurate of an indicator, especially when combined, because they provide a "what if I start right now" view of strategies.   This is my intend with posting this on a day-by-day entry.

Go back through older blog entries to review the consistency of the 1-year rolling snapshots.  

~~~~~~~~~

As with all my ramblings, you are responsible for your own investment decisions and I am not.  Please do your own diligence, and please take ownership for your actions.

Regards,

pgd


Thursday, February 9, 2017

Trades Into Thursday, February 9th

.
If you are on the blog page in a web browser from a computer, please subscribe to this using the "Follow by Email" link to the left.  Having your email helps me to notify you when Google mucks up email distribution, as they did at the beginning of May.

A couple of readers have indicated they do not see the "Follow by Email" area to enter their email.  If you are using a mobile device (iPad, phone, etc.) you may see a button "View web version" under the "Home" button at the bottom of your screen (scroll down).  Select "View web version" and you should see the area.

Many thanks to Ron Speiker for checking my work.  He found an inconsistency at the beginning of the reporting period (1-year lookback) and because of this I have found some challenges with the TradeStation Portfolio Maestro testing platform in general.  These errors do NOT impact current trades -- they only impact historical trades and reporting, It appears that I have fixed the inconsistency as of this morning but will be sending new data to him for independent review.  As he (and others) know, this type of verification is quite tedious so again, my heartfelt thanks.  This is NOT to say Ron is endorsing this work -- he is simply looking over my shoulder, which I appreciate.

~~~~~~~

Here are the theoretical holdings going into today's open:


Note that there were four positions that were opened yesterday, on 2/8, at the open.

My actual holdings going into the open for today are:


Two positions are signalling a close at the open:

  • STC 119 shares EWH @ Open (TPS strategy)
  • STC 82 shares ILF @ Open (TPS strategy)
In reality I will make the orders valid after 9;31 AM so not to get the wild swing on the open.  History has proven to me that I *never* get the first trade at the open price.

This adjustment will add slippage, which I will track.

~~~~~~~


Historical, rolling, 1-year performance is as follows.  The error with TradeStation Portfolio Maestro has been addressed to the best of my knowledge, pending independent review.  The numbers will be different than previous blog entries because this is a ROLLING snapshot -- the period shown below is 2/10/2016 to 2/9/2017:


Summary Value
Total Return $9,184.96
Total Realized Return $9,277.79
Gross Profit $12,311.59
Gross Loss ($3,033.80)
Open Trade P/L ($92.83)
   
Number of Trades 174
Number of Winning Trades 130
Number of Losing Trades 44
% Profitable 74.71%
   
Average Trade $53.32
Average Trade (%) 0.86%
Standard Deviation Trade $138.65
Standard Deviation Trade (%) 1.72%
Largest Winning Trade $664.90
Largest Losing Trade ($561.36)
   
Profit Factor 4.06
Average Win / Average Loss 1.37
Sharpe Ratio 0.2661
K-Ratio 0.6342
Return Retracement Ratio 18.9291
   
Compounded Annual Return 15.78%
Compounded Monthly Return 1.21%
   
Average Annual Return $4,592.48
Average Annual Return (%) 7.74%
Average Monthly Return $706.54
Average Monthly Return (%) 1.14%
   
Percent Days Profitable 43.25%
Percent Months Profitable 84.62%
Percent Years Profitable 100.00%
   
Commissions on Futures $0.00
Commissions on Currencies $0.00
Commissions on Equities $786.99
Total Commissions $786.99

Rolling snapshots are far more accurate of an indicator, especially when combined, because they provide a "what if I start right now" view of strategies.   This is my intend with posting this on a day-by-day entry.

~~~~~~~~~

As with all my ramblings, you are responsible for your own investment decisions and I am not.  Please do your own diligence, and please take ownership for your actions.

Regards,

pgd