Saturday, April 8, 2017

Weekend & Performance Update, Trades into Monday, April 10th

.
If you are on the blog page in a web browser from a computer, please subscribe to this using the "Follow by Email" link to the left.  Having your email helps me to notify you when Google mucks up email distribution, as they did in early March 2017.

~~~~~~~

There is one sell order for the open on Monday.

There are two buy orders for the open on Monday.

~~~~~~~

XLV, which is presently held in the RSI 25 strategy, closed Friday with an RSI(4) > 50.3, signalling an exit.  The order is:

  • STC 56 shares XLV market at 9:32 a.m.  
The position is presently above the water line so provided it fills above $74.11 it should go into the win column.

The two buy orders are each in the TPS strategy.  Base portfolio size is $67,483, including the recent gains.


The TPS strategy allows 4 positions.  A fully loaded position would be $16,870.  One of the positions is a new, 10% scale in size, and the other is a 30% scale-in size.  10% is $1,687 and 30% is $5,061.  The orders are:
  • BTO 42 shares EEM market at 9:32 (TPS 10%)
  • BTO 81 shares EFA market at 9:32 (TPS 30%)
The present position(s) in EFA are collectively only $13 under the waterline despite holding 389 shares, so we are having a hard time moving aggressively lower (but *could* certainly go lower), so I am not concerned with the concentration in this ETF.

~~~~~~~~~

There are no option candidates for Monday.

~~~~~~~~~

Performance to Date

Here are some stats for those of you who have asked:

Number of winning trades:  35
Number of losing trades:  12
Win/Loss Ratio:  2.92: 1
% Wins:  74.47%
Average Win:  $35.66
Average Loss:  ($47.67)
Profit Factor:  2.182
PRR:  1.407

Total Gain since 2/1/2017, net of commissions:  1.02%
Annual Rate of Return:  6.42%
Buy and Hold Return:  0.35%
Average Monthly Return:  $228.82
Return Retracement Ratio:  14.34

Trading Period:  1 Mth, 27 Dys
Percent of Time in Market:  54.41%
Risk Adjusted Annual Rate of Return:  11.79%

Starting Portfolio Size:  $66,603

Here are various charts for your questioning:

Click on the image to enlarge.

Click on the image to enlarge.
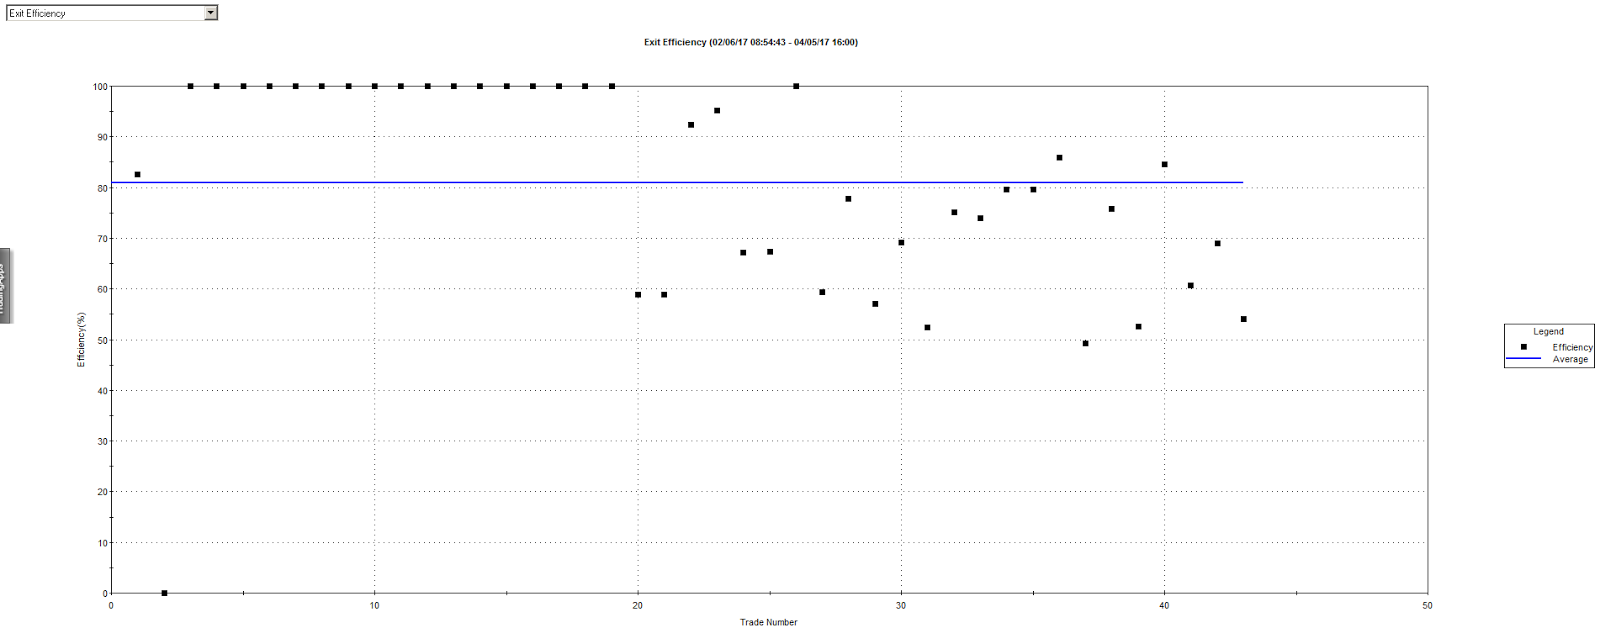
Click on the image to enlarge.

Click on the image to enlarge.


Click on the image to enlarge.


~~~~~~

3-Month Rolling Performance

Historical, rolling, annualized 3-month performance from the 3-month backscan is as follows.  The numbers will be different than previous blog entries because this is a ROLLING snapshot -- the period shown below is 1/9/2017 to 4/8/2017.  

Summary Value
Total Return $1,311.20
Total Realized Return $1,360.60
Gross Profit $2,260.97
Gross Loss ($900.37)
Open Trade P/L ($49.40)
Number of Trades 63
Number of Winning Trades 41
Number of Losing Trades 22
% Profitable 65.08%
Average Trade $21.60
Average Trade (%) 0.26%
Standard Deviation Trade $76.78
Standard Deviation Trade (%) 0.99%
Largest Winning Trade $294.25
Largest Losing Trade ($243.80)
Profit Factor 2.51
Average Win / Average Loss 1.35
Sharpe Ratio 0.1128
K-Ratio 0.1935
Return Retracement Ratio 7.2195
Compounded Annual Return 5.55%
Compounded Monthly Return 0.45%
Average Annual Return $1,311.20
Average Annual Return (%) 1.31%
Average Monthly Return $327.80
Average Monthly Return (%) 0.33%
Percent Days Profitable 39.68%
Percent Months Profitable 75.00%
Percent Years Profitable 100.00%
Commissions on Futures $0.00
Commissions on Currencies $0.00
Commissions on Equities $287.47
Total Commissions $287.47
The 3d High/Low strategy has been omitted from these results, as it is underperforming in the latest scan.

~~~~~~~~~

As with all my ramblings, you are responsible for your own investment decisions and I am not.  Please do your own diligence, and please take ownership for your actions.

Regards,

pgd


Friday, April 7, 2017

Trades into Friday, April 7th

.
If you are on the blog page in a web browser from a computer, please subscribe to this using the "Follow by Email" link to the left.  Having your email helps me to notify you when Google mucks up email distribution, as they did in early March 2017.

~~~~~~~

There is one ETF purchase order for Friday.

There are no Option purchases for Friday.

There are no sell orders for Friday.

~~~~~~~

The purchase order is with the TPS strategy, and is the second entry:

  • BTO 42 shares EFA market at 9:32 a.m.

Base portfolio size is $67,483, including the recent gains.

The TPS strategy allows 4 positions.  A fully loaded position would be $16,870.  A 20% scale-in is $3,374 in size.

~~~~~~~

3-Month Rolling Performance

Historical, rolling, annualized 3-month performance from the 3-month backscan is as follows.  The numbers will be different than previous blog entries because this is a ROLLING snapshot -- the period shown below is 1/8/2017 to 4/7/2017.  

Summary Value
Total Return $1,288.47
Total Realized Return $1,360.60
Gross Profit $2,260.97
Gross Loss ($900.37)
Open Trade P/L ($72.13)
   
Number of Trades 63
Number of Winning Trades 41
Number of Losing Trades 22
% Profitable 65.08%
   
Average Trade $21.60
Average Trade (%) 0.26%
Standard Deviation Trade $76.78
Standard Deviation Trade (%) 0.99%
Largest Winning Trade $294.25
Largest Losing Trade ($243.80)
   
Profit Factor 2.51
Average Win / Average Loss 1.35
Sharpe Ratio 0.1116
K-Ratio 0.1919
Return Retracement Ratio 7.059
   
Compounded Annual Return 5.52%
Compounded Monthly Return 0.44%
   
Average Annual Return $1,288.47
Average Annual Return (%) 1.29%
Average Monthly Return $322.12
Average Monthly Return (%) 0.32%
   
Percent Days Profitable 38.71%
Percent Months Profitable 75.00%
Percent Years Profitable 100.00%
   
Commissions on Futures $0.00
Commissions on Currencies $0.00
Commissions on Equities $285.26
Total Commissions $285.26

The 3d High/Low strategy has been omitted from these results, as it is underperforming in the latest scan.

~~~~~~~~~

As with all my ramblings, you are responsible for your own investment decisions and I am not.  Please do your own diligence, and please take ownership for your actions.

Regards,

pgd


Thursday, April 6, 2017

Trades into Thursday, April 6th

.
If you are on the blog page in a web browser from a computer, please subscribe to this using the "Follow by Email" link to the left.  Having your email helps me to notify you when Google mucks up email distribution, as they did in early March 2017.

~~~~~~~

There are 2 sell orders for the open.

There are 10 buy orders for the open.

~~~~~~~

The two sell orders are in the EWT and FXI positions.
  • STC 370 shares FXI market at 9:32 a.m.
  • STC 303 shares EWT market at 9:32 a.m.
I took the trades at the close yesterday afternoon (3:59 pm ET) and received 38.91 and 33.61, respectively.

The buy orders, and the respective strategies in parenthesis, are as follows:

  • BTO 68 shares EFA market at 9:32 a.m. (RSI 25)
  • BTO 115 shares XHB market at 9:32 a.m. (RSI 25)
  • BTO 136 shares EFA market at 9:32 a.m. (R3)
  • BTO 230 shares XHB market at 9:32 a.m. (R3)
  • BTO 21 shares EFA market at 9:32 a.m. (TPS)
  • BTO 29 shares EFA market at 9:32 a.m. (RSI 10/6)
  • BTO 46 shares XHB market at 9:32 a.m. (TPS)
  • BTO 54 shares EFA market at 9:32 a.m. (MDD)
  • BTO 56 shares XLV market at 9:32 a.m. (RSI 25)
  • BTO 66 shares EWJ market at 9:32 a.m. (MDD)
Base portfolio size is $67,483, including the recent gains.

The TPS strategy allows 4 positions.  A fully loaded position would be $16,870.  The new positions in EFA and XHB are first time entries to this strategy and are at 10% scale-in, so each order is $1,687 in size.

The RSI 25 strategy allows 8 positions.  This is a fully-loaded position size of $8,435.  The scale-in is 50/50, so each order is $4,217 in size.

The R3 strategy also allows 8 positions with no 2nd entry (each position is 100%).  Hence, the order size is $8,435.

The MDD strategy allows 12 positions.  A fully loaded position would be $5,623 in size.  The scale-in is 60/40, and these are 1st entries.  hence the size is $3,374.

The RSI 10/6 strategy allows 13 positions.  A fully loaded position would be $5,191.  The scale-in is 35/65, making the first entry $1,816 in size.

Combining orders to take advantage of commissions, we have
  • BTO 308 shares EFA market at 9;32 a.m.
  • BTO 391 shares XHB market at 9:32 a.m.
  • BTO  56 shares XLV market at 9:32 a.m.
  • BTO 66 shares EWJ market at 9:32 a.m.
~~~~~~~

The only option on these four ETFs worth pursuing is with EFA.  If I sell the April 62.5 call at $83 my total gain could be another 1.35% and monthly gain equating to 2.81%.  I am placing the following order:
  • STO 3 EFA 170421P62.5 0.83 limit GTC
~~~~~~~


3-Month Rolling Performance

Historical, rolling, annualized 3-month performance from the 3-month backscan is as follows.  The numbers will be different than previous blog entries because this is a ROLLING snapshot -- the period shown below is 1/7/2017 to 4/6/2017.  Roughly multiply the values by 4 to get an annual value (dollars and trades only; the other percentage metrics are accurate for the time period and need no multiplication).

Summary Value
Total Return $1,535.00
Total Realized Return $1,260.05
Gross Profit $2,448.17
Gross Loss ($1,188.12)
Open Trade P/L $274.95
   
Number of Trades 67
Number of Winning Trades 46
Number of Losing Trades 21
% Profitable 68.66%
   
Average Trade $18.81
Average Trade (%) 0.29%
Standard Deviation Trade $80.29
Standard Deviation Trade (%) 1.01%
Largest Winning Trade $211.72
Largest Losing Trade ($293.40)
   
Profit Factor 2.06
Average Win / Average Loss 0.94
Sharpe Ratio 0.1132
K-Ratio 0.1481
Return Retracement Ratio 6.4229
   
Compounded Annual Return 6.68%
Compounded Monthly Return 0.53%
   
Average Annual Return $1,535.00
Average Annual Return (%) 1.54%
Average Monthly Return $383.75
Average Monthly Return (%) 0.38%
   
Percent Days Profitable 45.90%
Percent Months Profitable 75.00%
Percent Years Profitable 100.00%
   
Commissions on Futures $0.00
Commissions on Currencies $0.00
Commissions on Equities $321.39
Total Commissions $321.39


Note that no strategies are omitted from these results.

~~~~~~~~~

As with all my ramblings, you are responsible for your own investment decisions and I am not.  Please do your own diligence, and please take ownership for your actions.

Regards,

pgd


Wednesday, April 5, 2017

Trades into Wednesday, April 5th

.
.
If you are on the blog page in a web browser from a computer, please subscribe to this using the "Follow by Email" link to the left.  Having your email helps me to notify you when Google mucks up email distribution, as they did in early March 2017.

~~~~~~~

There is one buy order for the open.

There are no sell orders for the open.

~~~~~~~

The buy order is:
  • BTO 45 shares XHB market at 9;32 a.m.
The XHB order is from the TPS strategy.  The TPS strategy allows for 4 open positions, so the fully-loaded position size is $67,408 / 4 = $16,852.  10% of this is $1,685.

~~~~~~

Three option orders filled yesterday:

  • EFA 170421P62 @ 0.52 
  • EWJ 170421C52 @ 0.20 
  • EFA 170421P62.5 @ 0.75

All have a positive value this morning.

There are no option orders available today that meet the 500 contract open interest minimum.
~~~~~~~

3-Month Rolling Performance

Historical, rolling, annualized 3-month performance from the 3-month backscan is as follows.  The numbers will be different than previous blog entries because this is a ROLLING snapshot -- the period shown below is 1/6/2017 to 4/5/2017.  Roughly multiply the values by 4 to get an annual value (dollars and trades only; the other percentage metrics are accurate for the time period and need no multiplication).


Summary Value
Total Return $1,393.41
Total Realized Return $1,230.22
Gross Profit $2,211.54
Gross Loss ($981.32)
Open Trade P/L $163.19
Number of Trades 61
Number of Winning Trades 39
Number of Losing Trades 22
% Profitable 63.93%
Average Trade $20.17
Average Trade (%) 0.29%
Standard Deviation Trade $78.70
Standard Deviation Trade (%) 1.00%
Largest Winning Trade $294.25
Largest Losing Trade ($243.80)
Profit Factor 2.25
Average Win / Average Loss 1.27
Sharpe Ratio 0.1298
K-Ratio 0.2248
Return Retracement Ratio 7.6103
Compounded Annual Return 5.91%
Compounded Monthly Return 0.47%
Average Annual Return $1,393.41
Average Annual Return (%) 1.39%
Average Monthly Return $348.35
Average Monthly Return (%) 0.35%
Percent Days Profitable 37.70%
Percent Months Profitable 100.00%
Percent Years Profitable 100.00%
Commissions on Futures $0.00
Commissions on Currencies $0.00
Commissions on Equities $276.02
Total Commissions $276.02


The 3d High/Low and MDD strategies are omitted from these results, as they are underperforming in the latest scan.

~~~~~~~~~

As with all my ramblings, you are responsible for your own investment decisions and I am not.  Please do your own diligence, and please take ownership for your actions.

Regards,

pgd

Tuesday, April 4, 2017

Trades into Tuesday, April 4th

.
If you are on the blog page in a web browser from a computer, please subscribe to this using the "Follow by Email" link to the left.  Having your email helps me to notify you when Google mucks up email distribution, as they did in early March 2017.

~~~~~~~

There is one pending trade for the open.


There are no closing trades for the open

~~~~~~~

The trade to be placed is in the TPS strategy:

  • BTO 27 shares EFA market at 9:32 a.m.
The TPS strategy allows for 4 open positions, so the fully-loaded position size is $67,408 / 4 = $16,852.  10% of this is $1,685.  

~~~~~~~

I listed a number of put and call options yesterday, and placed orders accordingly.  Not one of the orders filled.

Part of the reason was that the limit values were established prior to the market open and they never filled.  Another reason is that with the exception of FXI, the option volume on the weeklies is extremely low.  

To address this I am setting a screening criteria that the open interest, per strike, must be at least 500 contracts.  In doing so the pool reduces dramatically:
  • Long Call Apr 17 on EWJ @ 52
  • Short Put Apr 17 on EFA @ 62.5
  • Short Put Apr 17 on EFA @ 62
  • Short Put Apr 17 on EWT @ 33
Correspondingly, I've placed the following orders:
  • BTO 2 EWJ 170421C52 0.36 limit
  • STO 1 EFA 170421P62.5 0.55 limit
  • STO 1 EFA 170421P62  0.35 limit
  • STO 3 EWT 170421P33 0.24 limit
Futures are sharply lower as I write this.

~~~~~~~

3-Month Rolling Performance

Historical, rolling, annualized 3-month performance from the 3-month backscan is as follows.  The numbers will be different than previous blog entries because this is a ROLLING snapshot -- the period shown below is 1/2/2017 to 3/31/2017.  Roughly multiply the values by 4 to get an annual value (dollars and trades only; the other percentage metrics are accurate for the time period and need no multiplication).

Summary Value
Total Return $1,252.82
Total Realized Return $1,088.19
Gross Profit $1,394.16
Gross Loss ($305.97)
Open Trade P/L $164.63
   
Number of Trades 21
Number of Winning Trades 16
Number of Losing Trades 5
% Profitable 76.19%
   
Average Trade $51.82
Average Trade (%) 0.42%
Standard Deviation Trade $84.40
Standard Deviation Trade (%) 0.70%
Largest Winning Trade $198.66
Largest Losing Trade ($121.04)
   
Profit Factor 4.56
Average Win / Average Loss 1.42
Sharpe Ratio 0.1926
K-Ratio 0.2757
Return Retracement Ratio 11.1704
   
Compounded Annual Return 8.72%
Compounded Monthly Return 0.69%
   
Average Annual Return $1,252.82
Average Annual Return (%) 2.04%
Average Monthly Return $313.21
Average Monthly Return (%) 0.51%
   
Percent Days Profitable 32.79%
Percent Months Profitable 100.00%
Percent Years Profitable 100.00%
   
Commissions on Futures $0.00
Commissions on Currencies $0.00
Commissions on Equities $130.74
Total Commissions $130.74


The TPS, %B, RSI 10/6, and MDD strategies are newly omitted from these results, as they are underperforming in the latest scan.

~~~~~~~~~

As with all my ramblings, you are responsible for your own investment decisions and I am not.  Please do your own diligence, and please take ownership for your actions.

Regards,

pgd

Monday, April 3, 2017

2 Months Completed, Introducing Option Trades, Trades into Monday, April 3rd

.
If you are on the blog page in a web browser from a computer, please subscribe to this using the "Follow by Email" link to the left.  Having your email helps me to notify you when Google mucks up email distribution, as they did in early March 2017.

~~~~~~~

There are six (6) trades to be placed for the open on Monday morning.

There are no closing trades (account is flat).

~~~~~~~

The account basis has increased to $67,408.

The following orders will be placed on Monday, April 3rd:
  • BTO 50 shares EWT at market at 9;32 a.m. (TPS 10% Strategy)
  • BTO 43 shares FXI at market at 9:32 a.m. (TPS 10% Strategy)
  • BTO 109 shares FXI at market at 9:32 a.m. (RSI 25 Strategy)
  • BTO 163 shares EWJ at market at 9:32 a.m. (R3 Long Strategy)
  • BTO 253 shares EWT at market at 9:32 a.m. (R3 Long Strategy)
  • BTO 218 shares FXI at market at 9:32 a.m. (R3 Long Strategy)
The TPS strategy allows for 4 open positions, so the fully-loaded position size is $67,408 / 4 = $16,852.  10% of this is $1,685.  

The RSI 25 strategy allows for 8 open positions with a 50% first entry.  $67,408 / 8 = $8,426 * 50% = $4,213.

The R3 strategy also allows for 8 open positions with a 100% sole entry.  Position size = $8,426.

~~~~~~

The options strategy for these orders is to either:

1) Sell a put that is just in the money (one strike below, closest weekly or monthly), or
2) Buy a call that is just in the money (one strike below, closest weekly or monthly) 

I'll list both here.

If we want to sell a put against these signals, the following orders will be placed:
  • STO 1 EWT 170421P33 0.36 limit at open (TPS 10% Strategy) **
  • STO 1 FXI 170407P38 0.14 limit at open (TPS 10% Strategy) *
  • STO 1 FXI 170407P38 0.14 limit at open (RSI 25 Strategy) *
  • STO 2 EWJ 170407P51.5 0.27 limit at open (R3 Long Strategy)
  • STO 3 EWT 170421P33 0.36 limit at open (R3 Long Strategy) **
  • STO 1 FXI 170407P38 0.14 limit at open (R3 Long Strategy) *
* Will be combined in the order
** Will be combined in the order

If these execute at the limits then the credit will be $268, not including commissions.

Conversely, if we want to buy a call, we can place the following orders:
  • BTO 1 EWT 170421C33 0.60 limit at open (TPS 10% strategy) ^^
  • BTO 1 FXI 170407C38 0.63 limit at open (TPS 10% Strategy) ^
  • BTO 1 FXI 170407C38 0.63 limit at open (RSI 25  Strategy) ^
  • BTO 2 EWJ 170407C51 0.61 limit at open (R3 Long Strategy)
  • BTO 3 EWT 170421C33 0.60 limit at open (R3 Long strategy) ^^
  • BTO 3 FXI 170407C38 0.63 limit at open (R3 Long Strategy) ^
^ Will be combined in the order
^^ Will be combined in the order

If these execute at the limits then the debit will be $677, not including commissions.

Given that the close orders will be given when the underlying indicates close, it appears to me that there is an upside bias on the put side of the strategy, not on the call side.  We'll see.

~~~~~~~

3-Month Rolling Performance

Historical, rolling, annualized 3-month performance from the 3-month backscan is as follows.  The numbers will be different than previous blog entries because this is a ROLLING snapshot -- the period shown below is 1/2/2017 to 3/31/2017.  Roughly multiply the values by 4 to get an annual value (dollars and trades only; the other percentage metrics are accurate for the time period and need no multiplication).


Summary Value
Total Return $1,329.45
Total Realized Return $1,329.45
Gross Profit $2,343.92
Gross Loss ($1,014.47)
Open Trade P/L $0.00
Number of Trades 65
Number of Winning Trades 42
Number of Losing Trades 23
% Profitable 64.62%
Average Trade $20.45
Average Trade (%) 0.28%
Standard Deviation Trade $77.01
Standard Deviation Trade (%) 1.00%
Largest Winning Trade $294.25
Largest Losing Trade ($243.80)
Profit Factor 2.31
Average Win / Average Loss 1.27
Sharpe Ratio 0.1181
K-Ratio 0.21
Return Retracement Ratio 7.5868
Compounded Annual Return 5.70%
Compounded Monthly Return 0.46%
Average Annual Return $1,329.45
Average Annual Return (%) 1.33%
Average Monthly Return $443.15
Average Monthly Return (%) 0.44%
Percent Days Profitable 33.87%
Percent Months Profitable 100.00%
Percent Years Profitable 100.00%
Commissions on Futures $0.00
Commissions on Currencies $0.00
Commissions on Equities $270.68
Total Commissions $270.68

The 3d High/Low and MDD strategies have been omitted from these results, as they have been recently underperforming in this market climate.

~~~~~~~~~

As with all my ramblings, you are responsible for your own investment decisions and I am not.  Please do your own diligence, and please take ownership for your actions.

Regards,

pgd