If you are on the blog page in a web browser from a computer, please subscribe to this using the "Follow by Email" link to the left. Having your email helps me to notify you when Google mucks up email distribution, as they did in early March 2017.
~~~~~~~
There is one sell order for the open on Monday.
There are two buy orders for the open on Monday.
~~~~~~~
XLV, which is presently held in the RSI 25 strategy, closed Friday with an RSI(4) > 50.3, signalling an exit. The order is:
- STC 56 shares XLV market at 9:32 a.m.
The position is presently above the water line so provided it fills above $74.11 it should go into the win column.
The two buy orders are each in the TPS strategy. Base portfolio size is $67,483, including the recent gains.
The TPS strategy allows 4 positions. A fully loaded position would be $16,870. One of the positions is a new, 10% scale in size, and the other is a 30% scale-in size. 10% is $1,687 and 30% is $5,061. The orders are:
- BTO 42 shares EEM market at 9:32 (TPS 10%)
- BTO 81 shares EFA market at 9:32 (TPS 30%)
The present position(s) in EFA are collectively only $13 under the waterline despite holding 389 shares, so we are having a hard time moving aggressively lower (but *could* certainly go lower), so I am not concerned with the concentration in this ETF.
~~~~~~~~~
There are no option candidates for Monday.
~~~~~~~~~
Performance to Date
Here are some stats for those of you who have asked:
Number of winning trades: 35
Number of losing trades: 12
Win/Loss Ratio: 2.92: 1
% Wins: 74.47%
Average Win: $35.66
Average Loss: ($47.67)
Profit Factor: 2.182
PRR: 1.407
Total Gain since 2/1/2017, net of commissions: 1.02%
Annual Rate of Return: 6.42%
Buy and Hold Return: 0.35%
Average Monthly Return: $228.82
Return Retracement Ratio: 14.34
Trading Period: 1 Mth, 27 Dys
Percent of Time in Market: 54.41%
Risk Adjusted Annual Rate of Return: 11.79%
Starting Portfolio Size: $66,603
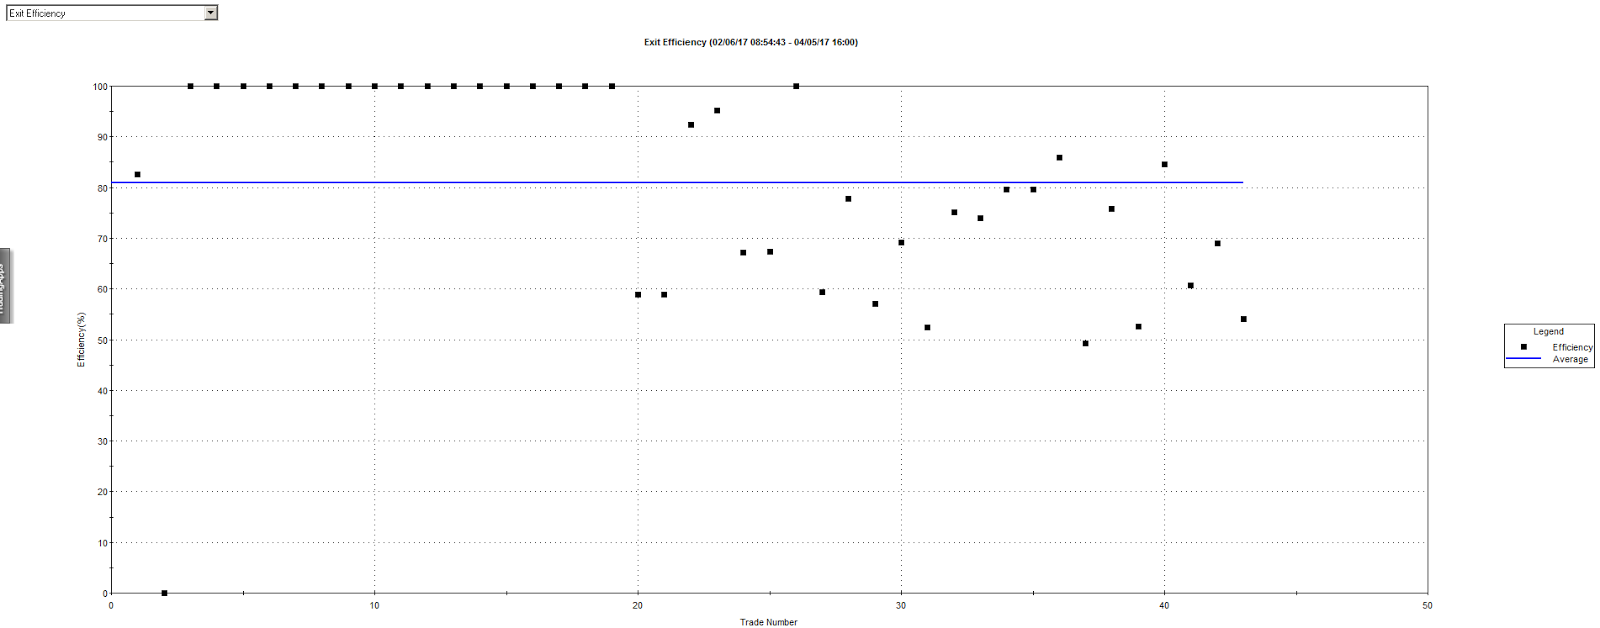
Here are various charts for your questioning:

Click on the image to enlarge.

Click on the image to enlarge.
Click on the image to enlarge.

Click on the image to enlarge.

Click on the image to enlarge.
~~~~~~
3-Month Rolling Performance
Historical, rolling, annualized 3-month performance from the 3-month backscan is as follows. The numbers will be different than previous blog entries because this is a ROLLING snapshot -- the period shown below is 1/9/2017 to 4/8/2017.
| Summary | Value |
| Total Return | $1,311.20 |
| Total Realized Return | $1,360.60 |
| Gross Profit | $2,260.97 |
| Gross Loss | ($900.37) |
| Open Trade P/L | ($49.40) |
| Number of Trades | 63 |
| Number of Winning Trades | 41 |
| Number of Losing Trades | 22 |
| % Profitable | 65.08% |
| Average Trade | $21.60 |
| Average Trade (%) | 0.26% |
| Standard Deviation Trade | $76.78 |
| Standard Deviation Trade (%) | 0.99% |
| Largest Winning Trade | $294.25 |
| Largest Losing Trade | ($243.80) |
| Profit Factor | 2.51 |
| Average Win / Average Loss | 1.35 |
| Sharpe Ratio | 0.1128 |
| K-Ratio | 0.1935 |
| Return Retracement Ratio | 7.2195 |
| Compounded Annual Return | 5.55% |
| Compounded Monthly Return | 0.45% |
| Average Annual Return | $1,311.20 |
| Average Annual Return (%) | 1.31% |
| Average Monthly Return | $327.80 |
| Average Monthly Return (%) | 0.33% |
| Percent Days Profitable | 39.68% |
| Percent Months Profitable | 75.00% |
| Percent Years Profitable | 100.00% |
| Commissions on Futures | $0.00 |
| Commissions on Currencies | $0.00 |
| Commissions on Equities | $287.47 |
| Total Commissions | $287.47 |
The 3d High/Low strategy has been omitted from these results, as it is underperforming in the latest scan.
~~~~~~~~~
As with all my ramblings, you are responsible for your own investment decisions and I am not. Please do your own diligence, and please take ownership for your actions.
Regards,
pgd
No comments:
Post a Comment